Process Improvement, KPOVs and Data

Overview
Lean Sigma is different to many traditional process improvement initiatives in its reliance on data to make decisions. During the define stage of lean sigma you identify the major metrics, otherwise known as the Key Process Output Variables (KPOVs) or Big Ys, to measure performance of the process.
Thenceforth for the improvement you use the equation Y = f(X1,X2,..., Xn) to identify and narrow down the Xs that drive the Y. Improvement is completely data driven.
Prior to undertaking that road, you need to have a basic understanding of data, measurements and how to deal with them.

This Data Analysis Video teaches you the basic tools for understanding, summarizing, and making future predictions with your collected data. Includes MS Excel templates.
Different Ways To Categorize Data and Measures:
Continuous versus Attribute
Results versus Predictors
Efficient versus Effective
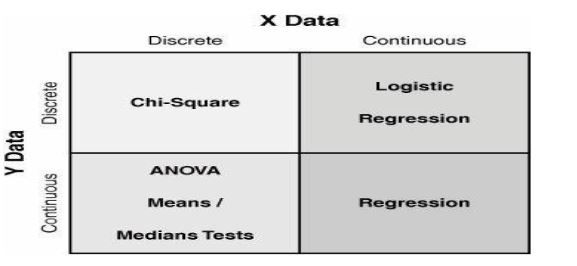
The type of data is important to process improvement. Types of data affects how measurements are defined, how to go about collecting data, and which tools to use in analyzing the data. An example is shown below
Selecting the statistical tool based on the data type.
Continuous Measures and Process Improvement
Continuous measures come from an infinitely divisible scale, such as weight, temperature, height, time, speed, and decibels. They are often called Variable measures.
One prefers continuous data over Attribute type data because it allows the use of more powerful statistical tests. Continuous data facilitates decisions being made with much less data (a sample size of 30 works well). Continuous data allows measurement of performance (i.e., how good is it?) versus conformance (i.e., is it just good or bad?).
If the data used in a process improvement project is attribute type, then we recommend identifying a related continuous type measure and use that instead.

Learn SPC in an hour. Train your employees. Improve your processes and products. Prevent defects and save your company money.
Attribute Measures
Non continuous measurements are known as Attribute or Discrete measures. Despite the lower statistical power, they are generally easier and faster to use than continuous data. Attribute data are effective for measuring intangible factors such as customer satisfaction or perception.
There are several different types of Attribute data along a spectrum as follows:
- Binary has just two categories to classify the data. For example, pass/fail, win/lose, or good/bad
- Count is a simple count of entities. For example, the number of defects or the number of defective items
- Percentage or Proportion is the count expressed as a percentage or proportion of the total. For example, the percentage of items scrapped or the proportion of items damaged
As the number of categories increase in Attribute data, it becomes more like continuous data.
The key failings of Attribute data is the need for a large number of observations to get valid information from any tests performed. Also attribute data can hide important discrimination.
Results
The Lean Sigma equation Y = f(X1,X2,..., Xn) shows the relationship between the Result (the Y) and the Predictors (the Xs). Results are often called "output" factors or KPOVs. Results might be short-term (on-time delivery) or longer-term (Customer satisfaction), but they are typically lagging indicators.
Since multiple Xs drive the results in the process improvement, results are reactive rather than proactive variables.
Results tend to be much easier to collect than Predictors. Analysis of a result is typically done against a specification and becomes a Process Capability measure.

8D Manager Software with 8D, 9D, 5Y and 4M report generator. Your corrective action software for managing, measuring, and reporting issues.
Predictors
Predictors are the upstream factors that, if measured, can forecast events downstream in the process. For example, an increase in raw-material order lead times might predict an increase in late deliveries. Predictors are the Xs in the equation Y = f(X1,X2,..., Xn). We call these input factors or KPIVs.
Predictors are the leading indicators of the process. Generally are more difficult to identify and collect. When starting a process improvement project, it is unlikely that this data is available historically. The Team must set up a measurement system to collect KPIVs.
Due to the proactive nature of Predictors, they form the basis of the strongest process improvement measures.
Effectiveness
We use two categories of metrics to describe the Big Ys in the process, namely effectiveness and efficiency. Effectiveness externally measures the process related to the voice of the customer (VOC). An effective process produces the desired results from the Customer's perspective.
To understand effectiveness, ask questions such as...
- How closely are Customers' needs and requirements met?
- What defects have they received?
- How satisfied and loyal have they become?
Effectiveness measures include
- Delivery performance.
- Quality performance
- Customer Satisfaction.
TrainingKeeper Software. Keep, organize and plan all your employees' training and activities. Software includes multi-user support with reports, certs, and calendars.
Efficiency
Efficiency internally measures the process. Efficiency relates to the level of resources used in the process to achieve the desired result.
To understand process improvement efficiency, ask these business internal questions...
- What is the process cycle time?
- What is the process yield?
Efficiency metrics include
- Process Lead Time
- Work content, such as assembly time per unit
- Process cost, such as labor and materials cost per unit
- Resources required
- Cost of poor quality (COPQ), such as Defects per Million Opportunities (DPMO), First Pass Yield, Scrap, Rework, Re-inspect, and Re-audit
During process improvement each process should have at least two efficiency requirements established:
- A ratio of input-to-output value, such as cost per entity processed or process yield
- A measurement of cycle time, such as hours to process an entity

Your comprehensive package for learning and training the TRIZ problem solving methodology. Includes mobile app, books, PowerPoints and real world examples.
Operational Definitions
After identifying a metric, the work isn't complete. To be a useful metric, you must create a clear, precise description of the metric. The description allows everyone to evaluate and count the same way. There is a common understanding of and agreement on the results.
In transactional processes in particular, Operational Definitions are often the only real way to maintain control. If poorly defined they are commonly the biggest cause of measurement system issues.
To describe a measure fully, create an Operational Definition that includes
- Who measures (by role, not person's name)
- What they measure (entities, measurement units)
- When they measure (timing and frequency)
- Where they measure (physical location in the process to make measure)
- How they measure (technique, equipment, steps involved)
- Why they measure (what is the measure used for)
Roadmap
Follow this roadmap to identifying, defining, and capturing data during your process improvement:
Step 1
Identify the process improvement measures that translate into meaningful data. Determine if each measure is a KPOV or KPIV, if it is a measure of effectiveness or efficiency, and if it is continuous or attribute.
Step 2
Create a clear Operational definition of the characteristic to be measured (who, what, when, where, how, and why).

Comprehensive ISO 9001:2015 Audit Checklist for Internal, Gap and Certification Audits.
Step 3
Test the Operational Definition with process improvement the Stakeholders (all those that affect and are affected by the process improvement) to ensure consistency in understanding. Revise the operational definition if necessary. Any metric chosen should be both repeatable and reproducible
Lean Sigma projects normally actively capture data so the team has to create a data collection and sampling plan. Historical data can be extremely useful when available; however, it is typically not based on the same operational definitions. Historical data may be hard to use (not stratified the right way, not sortable, and so on,) and generally incomplete.
Step 4
Before collecting the data, take time to consider how the team will analyze the data after it is collected. Determine the Xs with respect to their effects on the Ys, and so on. To facilitate this, build the Xs need into the data collection plan. KPIV may include things such as time, date, person, shift, operation number, Customer, buyer, machine, subassembly #, defect type, defect location, component and defect impact and criticality, and so on. The Xs should come from the Cause & Effect Matrix.
Be aware though that the number of sub-categories has a big impact on the amount of data required from which to make statistical inferences.

Your easy to edit ISO 9001:2015 Quality Assurance Manual.
Step 5
Create a sampling plan. Data collected is only a sample from the process; it never represents every entity to be processed (known as the population). Even if you collect 100% of the data points for the process improvement during a certain period of time, it is still only a sample of the whole population. In fact, this issue drives the use of statistics in the roadmap.
We use statistics because only a sample taken from the population. The statistical properties of the sample draws inferences (predictions, guesses) as to the properties of the population. Statistics make it faster, less costly way to gain insight into a process or large population.
The trick is to have the best sample from which to make inferences. Thus the sample needs to be a miniature version of the population, only smaller. To achieve this consider these two elements when sampling : sample quality and sample size.
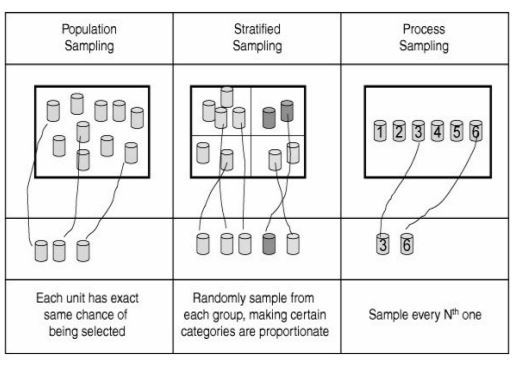
Sample quality measures how well the sample represents the population and meets the needs of the sampler. Lean Sigma statistical methods generally assume random sampling in which every entity or member of the full population has an equal chance of being selected in the sample. See below figure for different sampling strategies.
When sampling the team must strive to minimize the bias in the sampling procedure. Bias is the difference between the nature of the data in the sample and the true nature of the entire population. Avoid convenience sampling. Don't sample because the item is easy to get to. Difficult customers are hard to capture data from but represent a valuable source of information. Minimize data errors and missing data.

Snap Sampling Plans! software combines all the key industry standard attribute sampling plans into one place.
With over 10,000 sampling possibilities, Snap Sampling Plans! guides you in selecting the correct AQL sampling plan.
Sample Size is important because, generally, precision in sampling results increases as the sample size n increases. Unfortunately, this is not a one-to-one relationship. In fact, mathematically precision's increases in proportion to so doubling sample size doesn't double accuracy.
For Continuous data meaningful Sample Sizes are
- Estimating Average: >10 data points
- Estimating level of Variation: >30 data points
For Attribute Data meaningful Sample Sizes are
- Estimating Proportion, or Percent: ~100 data points
Step 6
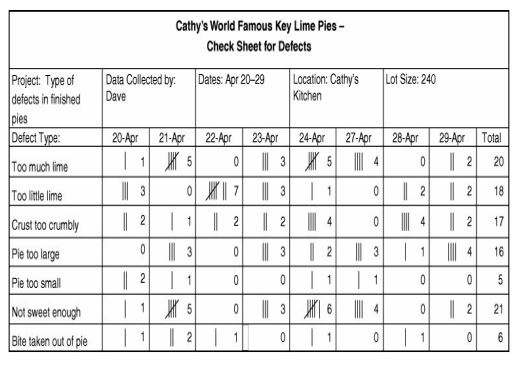
Based on the sampling plan, create a data collection form and tracking system. This comprises the who, what, where, when, and how the data is captured. See the below Check sheet for an example.
Step 7
Create procedures for completing the data collection forms. Any instructions should be visual examples and understandable by all. It is useful to include pictures of the form, describe what goes in each box and include examples of the completed forms. Choose the data collectors carefully and train them on the procedures using the instructions to ensure consistent data collection.
This Data Analysis Video teaches you the basic tools for understanding, summarizing, and making future predictions with your collected data. Includes MS Excel templates.
Step 8
Test the data collection method. Do a short dry run of the data capture (a few data points) to identify problems and make adjustments. After completion, assess the accuracy, repeatability, and reproducibility of the data collection system
Step 9
Collect the data as per the data collection procedure. The team must follow the sampling plan consistently.
Record any changes in operating conditions not part of the normal or initial operating conditions. Any events out of the ordinary should be immediately written into a logbook.
Audit the data collection procedures and assure they're followed at all times. When the desired sample size is reached, stop the data collection.
Step 10
Enter the collected data promptly into a database, such as a spreadsheet or statistical software. Make a backup copy of the electronic file. Keep all the paper copies to be archived as part of the project report.
More Info
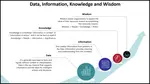
Data and Information
Data and Information, are often used interchangeably, they don’t mean the same thing
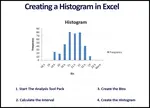
Histogram in Excel
Follow these steps to create a Histogram in Excel. This includes turning on data analysis, creating bins, and sorting data.
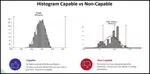
Histogram Examples: A Picture of Your Data
See our histogram examples. We discuss normal distribution and how it applies to quality assurance. Histograms are a key process improvement tool.
Learn Data Analysis Techniques
When you understand data analysis techniques, you take a big step towards making product and process improvements.

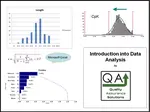
Data Analysis Video
Download Today. Don’t take chances without understanding your data. Data drives business decisions. But how does this work? This introduction to Data Analysis Video shows you how to gather, summarize, and present data to management and your team. $69.00. Satisfaction guaranteed.
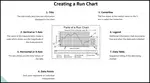
Run Chart
A Run Chart displays the process performance over time. It is a line graph of data points plotted in chronological order. Learn more!
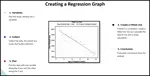
Regression
See our article on regression, includes details, collecting the data, examples, roadmap and possible problems
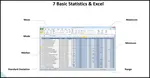
Data analysis in excel
Data analysis in excel discusses calculating averages, ranges, and standard deviation in Microsoft Excel.
Continuous Data
Learn how to evaluate your continuous data and assure satisfactory inspection. Without conducting an MSA on your data set, you put your inspection data at risk.
What is Data Analysis? A Tool for Continuous Improvement
What is data analysis? Understanding data is key to continuous improvement, your quality assurance systems and ISO 9001 certification.
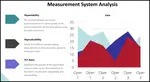
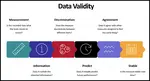
Validity for Measurement Systems
Understand Measurement System Analysis, and we present a road map to apply MSA Validity
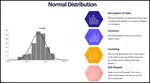
Statistics Normal Distribution Described
Do you know the statistics normal distribution? Normal distrubution is critical to know for your quality assurance program.
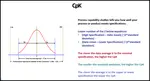
Understand Process Capability
Learn about Process Capability, Process Drift, PpK Vs CpK
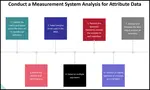
MSA Attribute data
An overview of MSA Attribute data and how MSA data affects your processes

Process Capability Studies
Process capability studies demonstrate the fit of your data to your specifications. Machine process capability determines current and future defects.
Chi Square
Learn how to apply Chi Square in practice, when to use it , how to insure results

- QAS Home
- Data Analysis
- Process Improvement, KPOVs and Data


 |
Software, Videos, Manuals, On-Line Certifications | |
 |
450+ Editable Slides with support links | |
|
|
Corrective Action Software | |
 |
Plan and Track Training | |
|
|
AQL Inspection Software | |
|
|
Learn and Train TRIZ |