Run Chart

A run chart displays process performance over time. It shows a line graph of data points plotted in chronological orderthat is, the time sequence of process data. These data points represent measurements, counts, or percentages of process output. They show process stability or trends. These charts form the basis of statistical control charts but they are not as powerful or useful as control charts.

Learn SPC in an hour. Train your employees. Improve your processes and products. Prevent defects and save your company money.
Why Use a Run Chart?
Using these charts helps you visualize your process. Unlike other tools, such as Pareto Charts or Histograms, these charts display data in the sequence in which they occur. This enables you to visualize your process performance which helps you detect signals of possible issues. You can analyze data for patterns that are not easily seen in tables or spreadsheets. These charts let you communicate with others the process performance during a specific time period.
It also allows you to present some simple statistics related to the process:
Median: The middle value of the data presented. You use this as the centerline.
Range: The difference between the largest and smallest values in the data. You use this to construct the Y-axis of your chart.
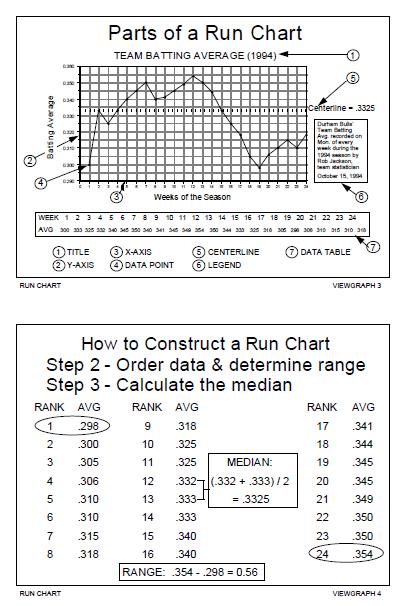
1. Title: The title briefly describes the information displayed in the chart.
2. Vertical or Y-Axis: The name of the measurement. Create a scale which shows you the magnitude of the measurements.
3. Horizontal or X-Axis: This axis shows you the time history of the data.
4. Data Points: Each point represents an individual measurement.
5. Centerline: The line drawn at the median value on the Y-axis is called the Centerline.
6. Legend: Additional information that documents how and when the data were collected
7. Data Table: Sequential listing of the data being charted.
More Info
Data and Information
Data and Information, are often used interchangeably, they don’t mean the same thing
Process Improvement and KPOVs
Lean Sigma is different to many traditional Process Improvement initiatives in its reliance on data to make decisions
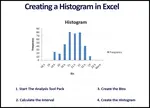
Histogram in Excel
Follow these steps to create a Histogram in Excel. This includes turning on data analysis, creating bins, and sorting data.
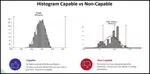
Histogram Examples: A Picture of Your Data
See our histogram examples. We discuss normal distribution and how it applies to quality assurance. Histograms are a key process improvement tool.
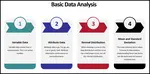
Learn Data Analysis Techniques
When you understand data analysis techniques, you take a big step towards making product and process improvements.


Data Analysis Video
Download Today. Don’t take chances without understanding your data. Data drives business decisions. But how does this work? This introduction to Data Analysis Video shows you how to gather, summarize, and present data to management and your team. $69.00. Satisfaction guaranteed.
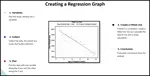
Regression
See our article on regression, includes details, collecting the data, examples, roadmap and possible problems
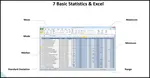
Data analysis in excel
Data analysis in excel discusses calculating averages, ranges, and standard deviation in Microsoft Excel.
Continuous Data
Learn how to evaluate your continuous data and assure satisfactory inspection. Without conducting an MSA on your data set, you put your inspection data at risk.
What is Data Analysis? A Tool for Continuous Improvement
What is data analysis? Understanding data is key to continuous improvement, your quality assurance systems and ISO 9001 certification.
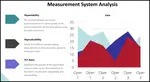
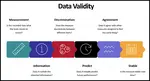
Validity for Measurement Systems
Understand Measurement System Analysis, and we present a road map to apply MSA Validity
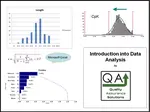
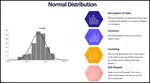
Statistics Normal Distribution Described
Do you know the statistics normal distribution? Normal distrubution is critical to know for your quality assurance program.
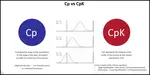
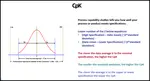
Understand Process Capability
Learn about Process Capability, Process Drift, PpK Vs CpK
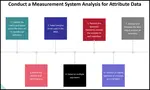
MSA Attribute data
An overview of MSA Attribute data and how MSA data affects your processes
Process Capability Studies
Process capability studies demonstrate the fit of your data to your specifications. Machine process capability determines current and future defects.
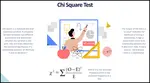
Chi Square
Learn how to apply Chi Square in practice, when to use it , how to insure results
- QAS Home
- Data Analysis
- Run Chart


 |
Software, Videos, Manuals, On-Line Certifications | |
 |
450+ Editable Slides with support links | |
 |
Corrective Action Software | |
 |
Plan and Track Training | |
 |
AQL Inspection Software | |
 |
Learn and Train TRIZ |