Process Capability

Prior to making any process changes, be sure to understand the current process capability.
The simplest form of Process Capability for continuous data is known as Cp
Cp is calculated as the ratio of the specification range divided by the process width where...s is the short-term process standard deviation... USL is the Upper Specification Limit and...LSL is the Lower Specification Limit
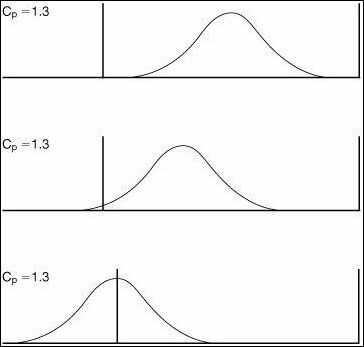
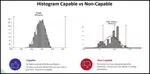
99.73% of data points lie between ±3 standard deviations in any normally distributed data. Cp doesn't take into account the centering of the process. The below figure shows 3 graphs with same Cp but different process centering

This Data Analysis Video teaches you the basic tools for understanding, summarizing, and making future predictions with your collected data. Includes MS Excel templates.
A second metric needs to be introduced to counter this; known as Cpk, it is defined as
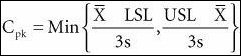
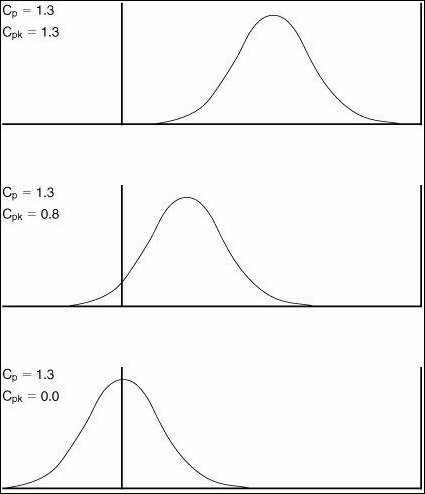
Cpk represents the distance of the center of the process to the nearest specification limit in units of the process width . Cpk is positive when the mean of the process is inside the specifications; it drops to zero as the mean hits the USL or LSL as shown below :

Learn SPC in an hour. Train your employees. Improve your processes and products. Prevent defects and save your company money.
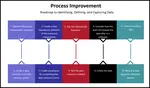
Process Capability Roadmap
First define the goals and specifications. Then collect the process data. Collect at least 30 data points.
To actually make a useful CpK calculation the process needs to be stable. If the process mean moves around or its variation changes unpredictably then you cannot meet customer requirements. To check stability create a histogram. If the histogram shows a bell shape curve, then consider the process normal. The Capability calculations of Cp and Cpk rely on the data being normal. Calculate Cp and Cpk as per the preceding equations. Most statistical software packages do this readily.
Process Drift
Process Capability (expressed as Cp and Cpk) represents short-term behavior of the process. In reality processes tend to shift and drift over time. The variation stays reasonably consistent, but the mean moves to and from.
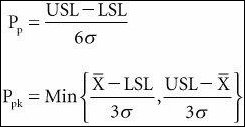
Taking this into account, the longer-term variation is actually larger than the short-term. The capability is lower in the long term than the short. Long-term capability is known as process performance and the equations are identical to those for Capability (short-term), but a longer-term standard deviation σ population instead of s sample is used
Empirical process studies show that most processes tend to shift and drift about 1.5 standard deviations.
Most software packages try to emulate this short-term versus long-term standard deviation by measuring it in two different ways. For long-term, the regular standard deviation of all the data is used. For short-term the value comes from an equation involving the moving average across the data. In the below figure, the within standard deviation represents short term and the overall standard deviation represents long term. The within value is used to calculate the Cp and Cpk, whereas the overall value is used to calculate the Pp and PpK.
This Data Analysis Video teaches you the basic tools for understanding, summarizing, and making future predictions with your collected data. Includes MS Excel templates.
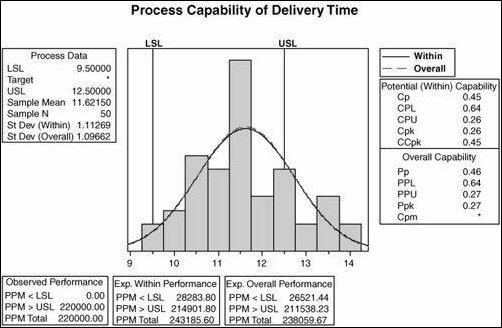
The target value for Cp in Six Sigma is 2.0 and for Ppk it is 1.5. These are not absolute requirements in any way, but if a process exhibits process capability at this level then it can be considered to be performing very well.
PPM
At the bottom of the above figure, the boxes explain the likely performance of the process in terms of Parts per Million defective (PPM):
The Observed Performance represents the PPMs of the actual data points below the LSL, above the USL, and the total of both. If no points fall outside of specification during the data collection, then the PPMs are zero.
The Within Performance represents the PPMs as calculated from a normal curve with the sample mean and short-term standard deviation. The calculated curve hangs over the LSL and USL, and thus, the area under the curve outside of the specification limits gives the PPMs. These are the expected defectives on a short-term basis.
The Overall Performance represents the PPMs as calculated from a normal curve with the sample mean and long-term standard deviation. The calculated curve hangs over the LSL and USL, and thus, the area under the curves outside of the specification limits gives the PPMs. These are the expected defectives on a long-term basis.
More Info
Data and Information
Data and Information, are often used interchangeably, they don’t mean the same thing
Process Improvement and KPOVs
Lean Sigma is different to many traditional Process Improvement initiatives in its reliance on data to make decisions
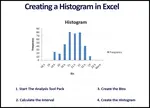
Histogram in Excel
Follow these steps to create a Histogram in Excel. This includes turning on data analysis, creating bins, and sorting data.
Histogram Examples: A Picture of Your Data
See our histogram examples. We discuss normal distribution and how it applies to quality assurance. Histograms are a key process improvement tool.
Learn Data Analysis Techniques
When you understand data analysis techniques, you take a big step towards making product and process improvements.


Data Analysis Video
Download Today. Don’t take chances without understanding your data. Data drives business decisions. But how does this work? This introduction to Data Analysis Video shows you how to gather, summarize, and present data to management and your team. $69.00. Satisfaction guaranteed.
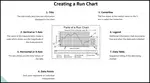
Run Chart
A Run Chart displays the process performance over time. It is a line graph of data points plotted in chronological order. Learn more!
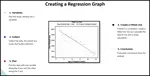
Regression
See our article on regression, includes details, collecting the data, examples, roadmap and possible problems
Data analysis in excel
Data analysis in excel discusses calculating averages, ranges, and standard deviation in Microsoft Excel.
Continuous Data
Learn how to evaluate your continuous data and assure satisfactory inspection. Without conducting an MSA on your data set, you put your inspection data at risk.
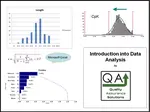

What is Data Analysis? A Tool for Continuous Improvement
What is data analysis? Understanding data is key to continuous improvement, your quality assurance systems and ISO 9001 certification.
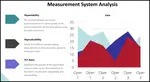
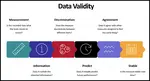
Validity for Measurement Systems
Understand Measurement System Analysis, and we present a road map to apply MSA Validity
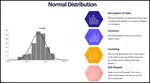
Statistics Normal Distribution Described
Do you know the statistics normal distribution? Normal distrubution is critical to know for your quality assurance program.
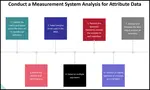
MSA Attribute data
An overview of MSA Attribute data and how MSA data affects your processes

Process Capability Studies
Process capability studies demonstrate the fit of your data to your specifications. Machine process capability determines current and future defects.
Chi Square
Learn how to apply Chi Square in practice, when to use it , how to insure results


 |
Software, Videos, Manuals, On-Line Certifications | |
 |
450+ Editable Slides with support links | |
 |
Corrective Action Software | |
 |
Plan and Track Training | |
 |
AQL Inspection Software | |
 |
Learn and Train TRIZ |