Continuous Data
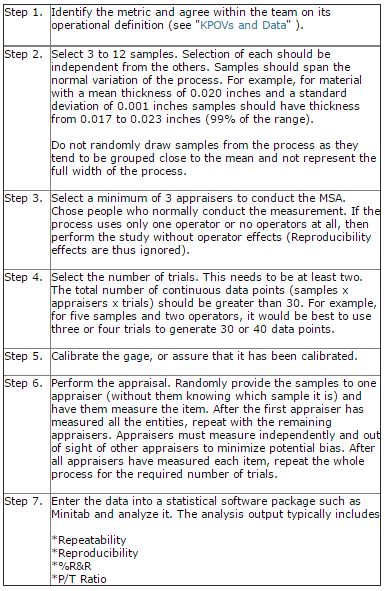
MSA
Measurement System Analysis

MSA - Continuous Data
Process variation affects how resulting products and services appear to Customers. This appearance includes not only the item's variability, but variation from the item's measurement.
For example, you measured the thickness of a pair of glasses' lens. Then you ask three other people to measure the lenses. It is highly likely that everyone answers differently. It is also highly likely that if someone handed you the same pair of glasses later (without you knowing it was the same pair) and asked you to measure again, you would come to a different measurement.
The pair of glasses did not changed. The measurement system caused the different answers and specifically errors within it. The higher the measurement error, the harder to understand the true process capability and behavior.
Includes an easy to edit Calibration Manual, recommended calibration system, reports and templates.
The sole purpose of a continuous data measurement system is to collect the right data to answer the questions being asked. To do this, the team must be confident in the integrity of the data being collected. To confirm data integrity the team must know...
- The type of data
- If the available data is usable
- If the data is suitable for the project
- If it is not suitable, whether it can be made usable
- How the data can be audited
- If the data is trustworthy
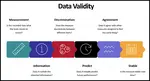
To answer these questions, break down continuous data integrity into two elements:
- Validity. Are your measuring the right aspect of the process or product? The continuous data might be from a reliable method or source, but still not match the operational definitions established for the project.
- Reliability. Is the valid measurement system producing continuous good data? This considers the accuracy and consistency of the data.
Gage R&R
To confirm validity and reliability, one uses a Gage R&R to conduct an audit on a continuous data measurement system. This involves using multiple people, multiple items, and multiple measurements to complete the audit . Each person measures every item at least twice. The Gage R&R data determines.
- Percentage overall agreement (% Repeatability & Reproducibility)
- Percentage agreement within individuals (% Repeatability, agreement with themselves)
- Percentage agreement between individuals (% Reproducibility, agreement with others)

This Data Analysis Video teaches you the basic tools for understanding, summarizing, and making future predictions with your collected data. Includes MS Excel templates.
Gage R&R vs Calibration
Gage R&R study examines the whole continuous data measurement system including the test samples, people, techniques, and methods. Many people confuse a Gage R&R Study with tool calibration but the two are different. Calibration considers only the reading and comparison to a known standard.
Gage R&R is significantly different and often far more difficult. It analyzes the entire variation within the measurement system.
Total Process Variation
The total process variation comes from the true process variation and the continuous data measurement system.
Total Variation = Process Variation + Measurement Variation
Or in statistical terms...
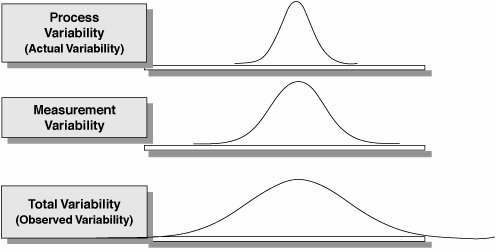
To effectively understand the process variation, the variability due to the measurement system needs to be small.

Learn SPC in an hour. Train your employees. Improve your processes and products. Prevent defects and save your company money.
Gage R&R Determines
- The size of the measurement error
- The sources of measurement error
- Whether the Measurement System is stable over time
- Whether the Measurement System is capable for measuring the process or product.
- Where in the Measurement System to focus improvement
Repeatability
The Gage R&R study breaks the total observed measured continuous data variation into two components repeatability and reproducibility:
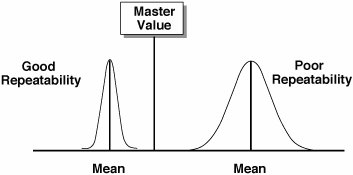
Repeatability variation occurs when repeated measurements are made of the same variable under absolutely identical conditions. It is the variation between successive measurements of the same sample, of the same characteristic, by the same person using the same instrument.
Poor repeatability causes an increase in decision error. When the same person looks at the same characteristic and measures different values he makes different decisions. Some of these decisions are the wrong decisions!
Source: SBTI's Lean Sigma Methodology training material.

8D Manager Software with 8D, 9D, 5Y and 4M report generator. Your corrective action software for managing, measuring, and reporting issues.
Reproducibility
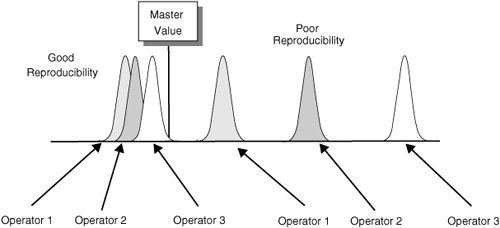
Reproducibility variation comes from different people making measurements on the same items using the same instrument. We examine this variation with different environmental conditions such as time, environment, temp, work conditions etc. When two or more individuals return the same value for a given characteristic, that measure is said to be reproducible.
Source: SBTI's Lean Methodology training material.
P/T Ratio
The P/T compares the size of the continuous data measurement system error with respect to the size of the specification. Since all measurement systems have variation, this metric lets you know if your measurement system variation is acceptable (or minimal) to measure a characteristic.
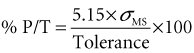
The P/T Ratio represents the percent of the specification tolerance taken up by measurement error. The metric includes both repeatability and reproducibility. An excellent continuous data measurement system has a P/T Ratio less than 10%. A value of 30% is barely acceptable.
5.15 standard deviations account for 99% of Measurement System variation. The use of 5.15 is an industry standard, but more recently some texts recommend the use of 6 standard deviations, which represents 99.73% of Measurement System variation. Either value is appropriate provided you use it consistently across the business.
Includes an easy to edit Calibration Manual, recommended calibration system, reports and templates.
%R&R
If you're measuring process improvement, without a specified tolerance, then we recommend using a more appropriate metric of %R&R. This represents the percentage of the total process variation taken by measurement error:
An excellent Measurement System has a %R&R less than 10%. A value of 30% is barely acceptable.
Discrimination
Discrimination (sometimes called resolution) represents the number of decimal places that can be measured by the system. Increments of measure should be about one-tenth of the width of the product specification or process variation.
8D Manager Software with 8D, 9D, 5Y and 4M report generator. Your corrective action software for managing, measuring, and reporting issues.
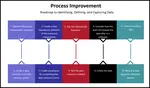
Roadmap
Interpreting The MSA SPC Output Charts
The SPC Range Chart should show a process that is in control. Repeatability is questionable if the range chart shows out-of-control conditions. If a point is above the UCL, that operator is having a problem making consistent measurements. If the range chart for an operator is out-of-control and the other charts are not, then the method is probably suspect. If all operators have ranges out-of-control, the system is sensitive to operator technique.
The Range Chart also helps identify inadequate discrimination. There should be least five distinct levels (points along the Y axis) within the Control Limits. Also, if there are more than 1/4 of the values at zero, then again, measurement discrimination is suspect.
Learn SPC in an hour. Train your employees. Improve your processes and products. Prevent defects and save your company money.
For the operator SPC Xbar Chart, the plot represents the average reading of each item measured. Due to part to part variation, the majority of the points on the chart should fall outside the control limits. In addition, the chart's pattern needs to be consistent for all the operators. If not then the reproducibility is suspect. If you see no points outside the control limits, then the selected samples did not cover the full range of the process (i.e. there was not enough part-to-part variation).
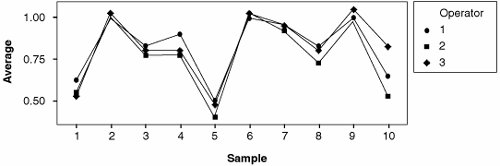
An Example Of Gage R&R Operator-Part Interaction Plot
Below is an example of an Operator-Part Interaction Plot. For a reliable continuous data measurement system, the lines should follow the same pattern and be reasonably parallel to each other. Crossing lines between operators indicate significant interactions. Furthermore, the part averages should vary enough that the differences between parts are clear.
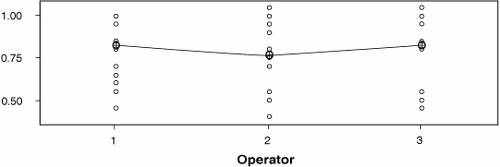
An Example of a Gage R&R By Operator Plot
Below is an example of a Gage R&R by Operator plot, which shows the average value (Circle) and the spread of the continuous data for each operator. The spread should be similar across all operators and there should be a flat line across the means of the operators.
Includes an easy to edit Calibration Manual, recommended calibration system, reports and templates.
Interpreting The Output Charts
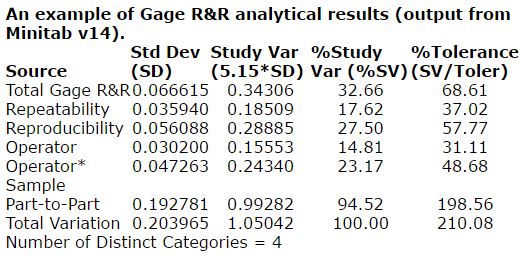
The Key Metrics To Examine
- The P/T Ratio (listed as the %Tolerance) at 68.61%. This gage is clearly unsuitable as a production gage (30% is acceptable).
- The %R&R (listed as %Study Variation) at 32.66%. This gage is less than acceptable to help make improvements to the process in question (30% is acceptable).
- The majority of the variation comes from reproducibility, which can be seen from its standard deviation (0.056088) versus repeatability (0.035940). Appraisers aren't agreeing with one another.
- The largest portion of reproducibility comes from an Operator-Sample interaction. In some way, due to the items measured characteristic, the operators measure different samples differently. This could occur when one or more appraisers aren't good with small parts, but can adequately measure larger parts, whereas others can measure all samples equally well.
- The Number of Distinct Categories is an indication of the discrimination of the measurement system. If the number of categories is less than five, the measurement system is of minimal value because it is difficult to distinguish one entity from another.
More Info
Data and Information
Data and Information, are often used interchangeably, they don’t mean the same thing
Process Improvement and KPOVs
Lean Sigma is different to many traditional Process Improvement initiatives in its reliance on data to make decisions
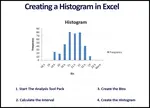
Histogram in Excel
Follow these steps to create a Histogram in Excel. This includes turning on data analysis, creating bins, and sorting data.
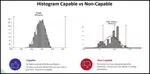
Histogram Examples: A Picture of Your Data
See our histogram examples. We discuss normal distribution and how it applies to quality assurance. Histograms are a key process improvement tool.
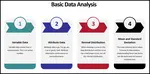
Learn Data Analysis Techniques
When you understand data analysis techniques, you take a big step towards making product and process improvements.


Data Analysis Video
Download Today. Don’t take chances without understanding your data. Data drives business decisions. But how does this work? This introduction to Data Analysis Video shows you how to gather, summarize, and present data to management and your team. $69.00. Satisfaction guaranteed.
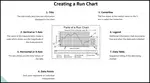
Run Chart
A Run Chart displays the process performance over time. It is a line graph of data points plotted in chronological order. Learn more!
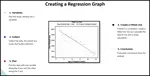
Regression
See our article on regression, includes details, collecting the data, examples, roadmap and possible problems
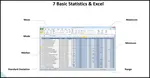
Data analysis in excel
Data analysis in excel discusses calculating averages, ranges, and standard deviation in Microsoft Excel.
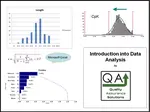
What is Data Analysis? A Tool for Continuous Improvement
What is data analysis? Understanding data is key to continuous improvement, your quality assurance systems and ISO 9001 certification.
Validity for Measurement Systems
Understand Measurement System Analysis, and we present a road map to apply MSA Validity
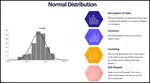
Statistics Normal Distribution Described
Do you know the statistics normal distribution? Normal distrubution is critical to know for your quality assurance program.
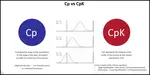
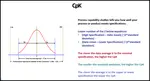
Understand Process Capability
Learn about Process Capability, Process Drift, PpK Vs CpK
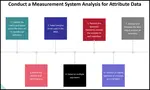
MSA Attribute data
An overview of MSA Attribute data and how MSA data affects your processes
Process Capability Studies
Process capability studies demonstrate the fit of your data to your specifications. Machine process capability determines current and future defects.
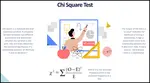
Chi Square
Learn how to apply Chi Square in practice, when to use it , how to insure results


 |
Software, Videos, Manuals, On-Line Certifications | |
 |
450+ Editable Slides with support links | |
|
|
Corrective Action Software | |
 |
Plan and Track Training | |
 |
AQL Inspection Software | |
 |
Learn and Train TRIZ |