Chi Square Test

Overview
Chi square is a statistical test that examines variation. It compares variation between two different populations and makes a determination of whether the variation is the same. This test helps determine the statistical significance of a relationship between an Attribute X and an Attribute Y in Y = f(X1,X2,..., Xn).
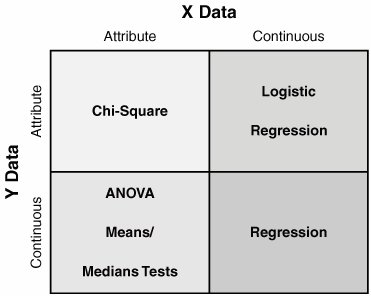
The approach used is to assume the variables (X Data and Y Data) are independent and set up the hypotheses as follows:
- Ho: Data are Independent (Not Related)
- Ha: Data are Dependent (Related)
The output of the test is a "p-value" indicates the likelihood of seeing a relationship. A high p-value means there is no relationship between the X data andY data. A low p value (< .10) indicates there is a relationship. A low p value cannot be purely by random chance. If the p-value is less than 0.10, then the null hypothesis Ho should be rejected and Ha should be accepted.
As with any statistical test, Chi Square comes with its set of "could be" and "might be" statements.

This Data Analysis Video teaches you the basic tools for understanding, summarizing, and making future predictions with your collected data. Includes MS Excel templates.
A Hypothesis Example
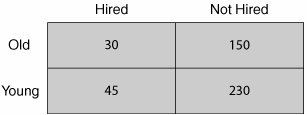
The Personnel Department wants to see if there is a link between age and whether an applicant gets hired. Both Age (old and young) and Got Hired (did or didn't) are attribute type data. A Chi2 test would be applicable to answer the question:
- Are age and hiring decisions dependent or independent
- Ho: Age and Hiring Decisions are independent
- Ha: Age and Hiring Decisions are dependent
455 data points were taken and the data distributed amongst the four possible outcomes. The data can then be analyzed in a statistical package, such as Minitab. The software calculates the expected values in each box. Chi-Square compares the observed with the expected frequencies to produce a signal-to-noise type ratio using :
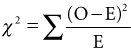
Where O is the observed frequency and E is the expected frequency in a box.
Sample of Reality for The Relationship Between Age and Hiring
The software then looks up the χ2 (the sum of all the discrepancies) value in a statistical table. As a belt using the tool practically, all that is important is the output of the tool, which should be similar to that shown below. The math behind χ2 is not covered here.
This Data Analysis Video teaches you the basic tools for understanding, summarizing, and making future predictions with your collected data. Includes MS Excel templates.
Results of the Chi Square test for the relationship between Age and Hiring Practice (output from Minitab v14).
Chi2: Hired, Not Hired
Expected counts are printed below observed counts. Chi Square contributions are printed below expected counts
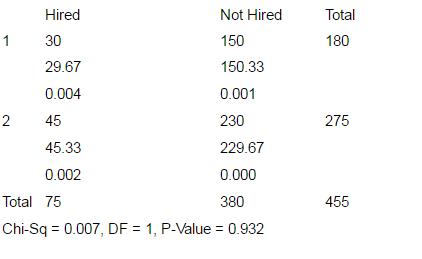
The first place to look is the p-value, which in this case p = 0.932. In this instance, the p-value is not low (not below 0.10). There is no relationship between Age and Hiring Practice is not significant for the sample of data taken.
Other Examples
Chi Square test can be applied in virtually any transactional processes where attribute data usually abounds. For example:
- HR Number of sick days by employee or department
- Accounting Number of incorrect expense reports by employee or department
- Sales Number of lost sales by account or region or country
- Logistics Number of deliveries late by distribution center or country
- Call Center Number of missed Customer calls by associate or shift
- Installation Number of repeat service calls by field technician
- Purchasing Number of days delivery-time for orders by supplier
- Inventory Number of parts by distribution center
Roadmap
The roadmap to setting up and applying a Chi Square test is as follows:
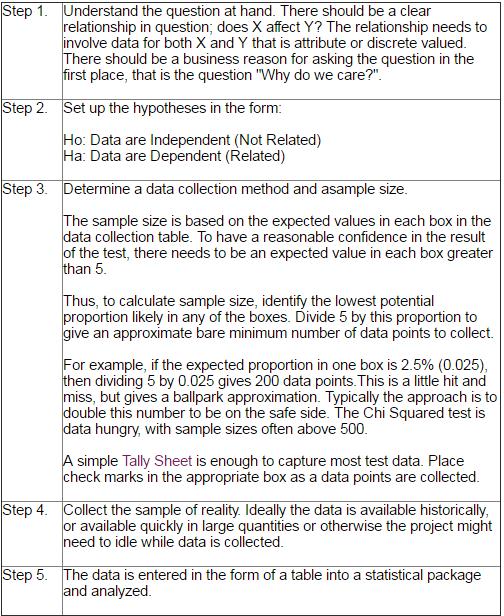
The first place to look during analysis is to the p-value. If the p-value is higher than 0.10 then the conclusion is that the X and Y are not dependent based on the taken sample.
However, if the p-value is low (less than 0.10) then there is reason to believe that the X and Y are dependent in some way. If everything was based on random chance, the distribution of data points within the table isn't expected
This Data Analysis Video teaches you the basic tools for understanding, summarizing, and making future predictions with your collected data. Includes MS Excel templates.
Low P Value
Consider the data below, which represents loan approval or rejection decisions on different days of the week. The bank clearly would like loan decisions to be independent of the processed work day.
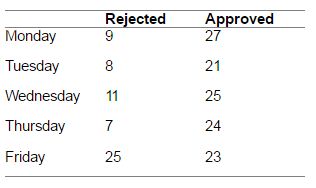
Test analysis results for loan data (output from Minitab v14).
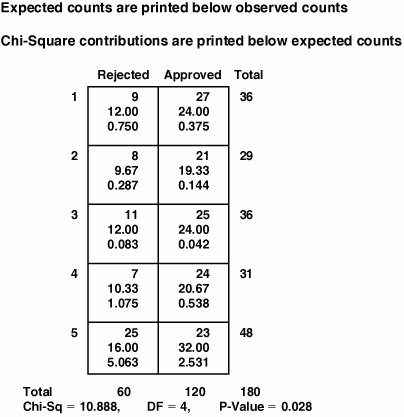
Looking immediately to the p-value of 0.028 (less than 0.10), it is clear that there is a dependent relationship. Thus, the conclusion is that the null hypothesis should be rejected and the alternate "Data are dependent" should be accepted instead. In English, we conclude there is something fishy going on, because the chances of getting a loan varies by day of the week.
More Info
Data and Information
Data and Information, are often used interchangeably, they don’t mean the same thing
Process Improvement and KPOVs
Lean Sigma is different to many traditional Process Improvement initiatives in its reliance on data to make decisions
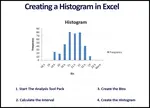
Histogram in Excel
Follow these steps to create a Histogram in Excel. This includes turning on data analysis, creating bins, and sorting data.
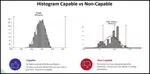
Histogram Examples: A Picture of Your Data
See our histogram examples. We discuss normal distribution and how it applies to quality assurance. Histograms are a key process improvement tool.
Learn Data Analysis Techniques
When you understand data analysis techniques, you take a big step towards making product and process improvements.


Data Analysis Video
Download Today. Don’t take chances without understanding your data. Data drives business decisions. But how does this work? This introduction to Data Analysis Video shows you how to gather, summarize, and present data to management and your team. $69.00. Satisfaction guaranteed.
Run Chart
A Run Chart displays the process performance over time. It is a line graph of data points plotted in chronological order. Learn more!
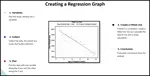
Regression
See our article on regression, includes details, collecting the data, examples, roadmap and possible problems
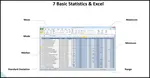
Data analysis in excel
Data analysis in excel discusses calculating averages, ranges, and standard deviation in Microsoft Excel.
Continuous Data
Learn how to evaluate your continuous data and assure satisfactory inspection. Without conducting an MSA on your data set, you put your inspection data at risk.
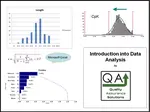

What is Data Analysis? A Tool for Continuous Improvement
What is data analysis? Understanding data is key to continuous improvement, your quality assurance systems and ISO 9001 certification.
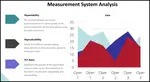
Validity for Measurement Systems
Understand Measurement System Analysis, and we present a road map to apply MSA Validity
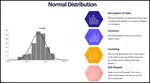
Statistics Normal Distribution Described
Do you know the statistics normal distribution? Normal distrubution is critical to know for your quality assurance program.
Understand Process Capability
Learn about Process Capability, Process Drift, PpK Vs CpK
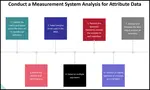
MSA Attribute data
An overview of MSA Attribute data and how MSA data affects your processes


Process Capability Studies
Process capability studies demonstrate the fit of your data to your specifications. Machine process capability determines current and future defects.


 |
Software, Videos, Manuals, On-Line Certifications | |
 |
450+ Editable Slides with support links | |
 |
Corrective Action Software | |
 |
Plan and Track Training | |
 |
AQL Inspection Software | |
 |
Learn and Train TRIZ |