Fish Bone

Fish Bone Diagram aso called: Cause-and-Effect Diagram or Ishikawa Diagram
Description:
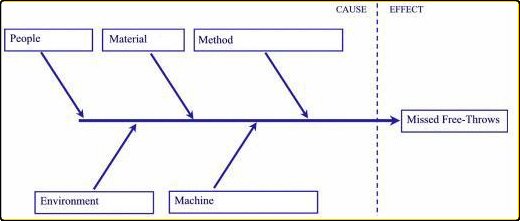
The Cause and Effect diagram identifies many possible causes for an effect or a problem. Your team can used this to structure a brainstorming session because it immediately sorts ideas into key categories.
- A 12 page manual on using the Fishbone Diagram.
- A blank Fishbone form to help you draw the diagram.
- A MS Excel template for making Fishbones.
When to Use
When your figuring out the possible factors for a problem.
When your teams thinking hits a roadblock.
Procedure:
1- Agree on the problem (effect). Write it at the center right (Fish Head) of the flipchart or whiteboard. Draw a box around it and draw a horizontal arrow running to it.
2- Brainstorm the possible major categories of causes of the problem (5M and 1E).
Methods
Machines (equipment)
Manpower (People)
Materials
Measurement
Environment

Comprehensive ISO 9001:2015 Audit Checklist for Internal, Gap and Certification Audits.
3- Write the categories of causes as branches from the main arrow.
4- Brainstorm all the possible factors for each of the major categories. Ask: Why does this happen? As each element is given, write it as a branch from the appropriate category (5M ). Causes can be written in several places if they relate to several categories.
5- Again ask why does this happen? about each branch from step 4. Write sub-causes branching off the causes. Continue to ask Why? and generate deeper levels of causes. Layers of branches indicate relationships.
6 After completion, have the team review the diagram. Identify elements that need to be investigated. Circle those items and assign investigation action items to the team.
More Info
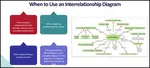
Interrelationship Diagram
Learn the steps to create an interrelationship diagram. Article also provides insight on when to use it too.
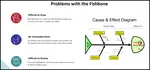
Fishbone Template Problems and Downloads
This page discusses how to improve the fishbone template, documents problems with the fishbone diagram template and fishbone charts.
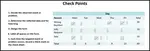
Check Points
Review this procedure creating check points, a continuous improvement tool. We include an example of a tally sheet too.
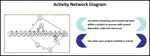
Details on Activity Network Diagram
The what, when, how and why of Activity Network Diagram
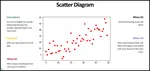
Scatter Diagram
Use a Scatter Diagram to investigate possible relationships. This article provides step by step instructions to creating one
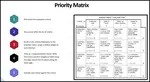
Priorities Matrix
A priorities matrix evaluates and prioritizes a list of options. Learn to formally construct one and analyze the results.
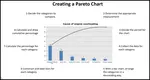
Pareto Chart
The Pareto chart is one of the total quality management tools and usually used during the define stage in six sigma
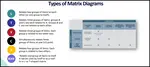
Matrix diagram
Learn the different types of matrix diagram which is a key quality tool.
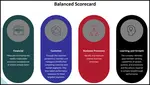
Balanced Scorecard
The Balanced Scorecard provides a clear prescription as to what companies should measure in order to 'balance' the financial perspective
Basic Tools for Process Improvement
Do you need a list of basic tools for process improvement? We provides a list of basic, advanced and favorite continuous improvement tools.
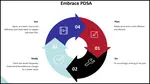
PDCA cycle
Learn the PDCA cycle, when to use it, how to construct it. We include an example of it too.
Customer Lifetime Value The Key
Customer lifetime value the key to understanding how much to invest into customer retention. Download a free spreadsheet for calculating LTV.


 |
Software, Videos, Manuals, On-Line Certifications | |
 |
450+ Editable Slides with support links | |
 |
Corrective Action Software | |
 |
Plan and Track Training | |
 |
AQL Inspection Software | |
 |
Learn and Train TRIZ |