My Beef with the Fishbone Template

The fishbone template is an interesting quality tool. It is one of Dr. Deming's 7 major tools. I believe all quality professionals should be familiar with this tool and use it at least once. It helps problem solvers think about the 4Ms (Machine, Man, Method and Material) of a problem.
The fishbone tool, biggest benefit... it helps problem solvers focus on the details of the problem. It provides a framework for the problem solver to drive issues down to the possible details. It presents a picture of the details.
In theory, one can take the fishbone, review it, and then isolate the key details of the problem. One can take the fishbone template, point to a "bone" and show this to another team member. As you're pointing, you say "here's the problem, this bone needs to be addressed"
In other articles, I've provided tools to create and teach the fishbone diagram. It's a good tool to teach because it helps students focus on the details. But in practical use, this tool has it share of problems.

8D Manager Software with 8D, 9D, 5Y and 4M report generator. Your corrective action software for managing, measuring, and reporting issues.
Difficult to Draw
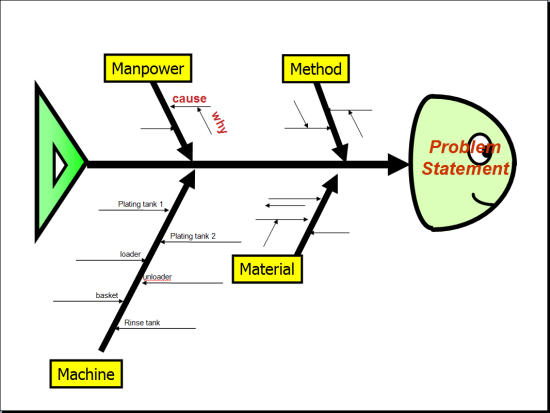
First it is hard to draw during a meeting. Besides the spine and head, you must draw 4 major bones to represent the 4M which are Man, Machine, Method, and Material. How large you make these bones depends on the number of items that branch off. If you are making one during a brainstorming session, you may find yourself adjusting the size of these bones depending on the number of brainstorming items that support the 4Ms. Be prepared to use your eraser quite a bit.
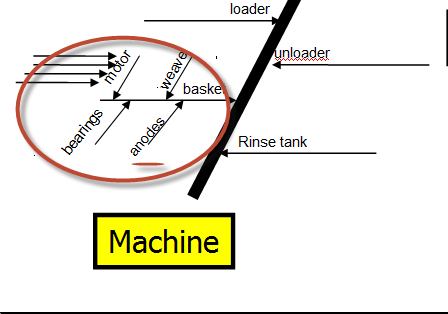
Lets call each item that supports the 4M as the "Major Item". For example under the Machine category in a plating process you can have basket, plating tank 1, plating tank 2, rinse tank, loader and unloader. In this case there are 6 machines. So there are 6 Major items that come off the Machine bone. See below.
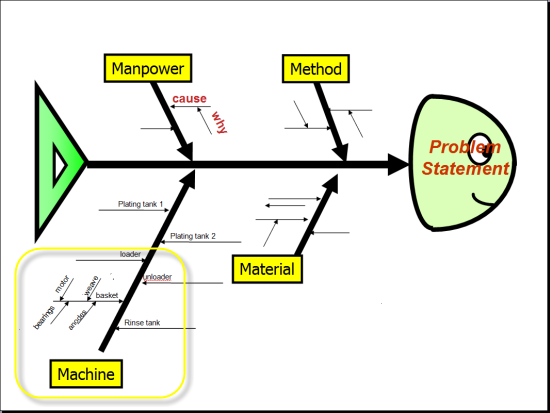
Now you need to draw the Support Items. For example for the basket support items contains the basket motor, basket weave, basket anodes, and basket bearings.
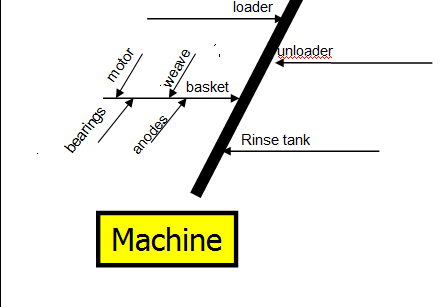
When you draw these four items with smaller bones connected to each of the Major item bones, you will find it difficult to draw. Smaller bones run into larger bones. There may not be enough room to draw all the smaller bones. You need to hand write smaller. See the below blown up picture.
Each of the other major items will also have support items. You will draw these too. By this time, the fishbone diagram starts to become a mess.
But we still need to add another detail, each of the smaller bones may have additional bones. For example the basket motor may have multiple support bones such as basket motor rotor, basket motor axle, basket motor magnet, basket motor armature, nand basket motor brush.
See the below picture. There is not much room to write the details.
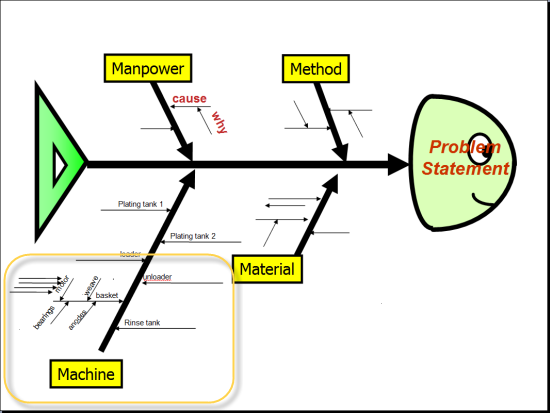
When you add these smaller bones to the support items, you starting to create a ugly fishbone diagram. By this time you have tons of eraser marks, small handwriting, and maybe notes on the side of the fishbone.
Most likely each of these sub support items have features that need to be addressed. For example the motor axle length, width, and thickness needs to be examined. Good luck on placing these on the fishbone. But these are important because wear could be the root cause of the problem.
Most likely after you create the initial fishbone template, you must redo it to make it readable and usable. So now instead of making one fishbone, you have to make it twice. If you have to do something twice, then the first one was a defect. The fishbone diagram is an inherently defective process improvement tool.
8D Manager Software with 8D, 9D, 5Y and 4M report generator. Your corrective action software for managing, measuring, and reporting issues.
No Actionable Items
The fishbone should drive action. You have the details, investigations need to occur. The fishbone helps drive down the details of the problem but the diagram does not indicate the action behind those details.
The fishbone template doesn't strongly indicate what needs to be investigated. When you undergo the investigation, specifically what are you examining, comparing or measuring?
The fishbone can show a lot of details. Do you focus on every detail? When you focus on a particular detail, what characteristic or function of that detail do you need to examine?
Who is going to examine that characteristic. What is the parameters of that characteristic? What is the due date of the examination? What were the results of that examination? How do we know that detail has been examine?
The fishbone lacks this information. You will need another document to cover the investigation when using a fishbone.
Difficult to Review
After the fishbone diagram is created, edited, and redone you should have a picture that shows the problem details.
In most cases the creator may have to write the words along the bones so descriptions fit the bones. Because the bones are angled to each other at the bone joints, the picture needs to be turn 90 degrees to read it. Then turn back 90 degrees to the next sub item. Back and forth for all the details. Try this in a group setting and watch the confusion grow.
If you don't highlight the specific issue, the reader may not have an idea the problem cause.
Finding a Fishbone Template That Works.
Every problem is different. Because of this you do not know the number of major items, the number of supporting items, and the number of sub-supporting items. There is no prepared fishbone template that could cover all the possibilities.
For every fishbone, you need to start from scratch. This is time consuming and a resource drain. Click here to learn how to make a Fishbone.
8D Manager Software with 8D, 9D, 5Y and 4M report generator. Your corrective action software for managing, measuring, and reporting issues.
Improving on the Fishbone
1) Use multiple fishbones for a problem. Break up the overall problem into multiple fishbones. If you have multiple machines in the problem, create one fishbone per one type of machine.
2) Don't create the fishbone during the brainstorming session. Instead list the 4Ms and have the team brainstorm the 4Ms. Create lists of each 4M item, supporting item, sub-supporting item, and measurement feature..
3) Create the fishbone diagram after the lists are created. Use flowchart software or PowerPoint to create the fishbone.
4) Place words on the diagram in one direction.
5) Highlight the area of concern on the fishbone.
6) Document only concerned details.
7) Create a table below the fishbone template with the action items.
8) Consider not using the fishbone. Combine items 2,5 and 6 into a 4M table.
What do you think? Agree or Disagree?
Tell me about it!
What Other Posters Have Said
Click below to see contributions from other visitors to this page...
Man the main cause Not rated yet
In the Fish Bone diagram almost all the causes are related to Man. Man made the machine, he operates it , he maintains it. Man produce the Method. Man …
Not agree completely nor disagree with the improving method given Not rated yet
Your presentation on the difficult of using the Fishbone is logically illustrated with the example that you chose.
The problem statement should give …
Agree Not rated yet
We have also found that by eliminating Man, you would find a solution that will error proof your system or process and Man will never be able to mess it …
AGREED! Not rated yet
Some Customers insist on it, & I find it adds little in direction of what to go into detail on, as you stated.
Agree Not rated yet
I've found it difficult to convey the concepts of the fishbone approach to problem solving, for the reasons stated in your article. Often, these exercises …
Additional Improvements Not rated yet
I agree that the fishbone is easy but crude. What I have done is to designate all of the "causes" as Controllable (C) or Noise (N) and in addition to …
Heading Descriptions Not rated yet
I agree with you. Often when this tool is being used for a group of people who have had no, or little exposure to it, the headings can be the stumbling …
Agreed Not rated yet
It is very difficult to make a detail fishbone to find specific root cause.Your statements are correct.
Agree Not rated yet
its good tool to sort out problem
Over hyping the negatives Not rated yet
Although I agree with a lot of what you pointed out about fishbones, I think you are over hyping trivial stuff.
Fishbones are a working document. They …
Small improvements for using CED Not rated yet
Instead of a pencil eraser and try to use self-adhesive paper cards. They can move and group work will become clearer and more interesting.
my favourite tool Not rated yet
Ever tried a mindmaptool like mindmanager (mindjet)? It helps me a lot in supporting the brainstorm (it has a fine brainstormmode) and assigning the ideas …
Create a Graphical Tool Not rated yet
Create a graphical tool program that provides for adjusting itself as you add to to solve the weaknesses of hand drawing the fishbone. That atleast would …
More Info
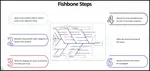
Fish Bone
Learn the steps to create a Fish Bone diagram.
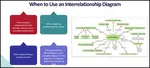
Interrelationship Diagram
Learn the steps to create an interrelationship diagram. Article also provides insight on when to use it too.
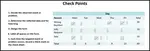
Check Points
Review this procedure creating check points, a continuous improvement tool. We include an example of a tally sheet too.
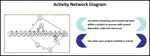
Details on Activity Network Diagram
The what, when, how and why of Activity Network Diagram
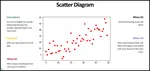
Scatter Diagram
Use a Scatter Diagram to investigate possible relationships. This article provides step by step instructions to creating one
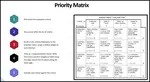
Priorities Matrix
A priorities matrix evaluates and prioritizes a list of options. Learn to formally construct one and analyze the results.
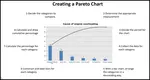
Pareto Chart
The Pareto chart is one of the total quality management tools and usually used during the define stage in six sigma
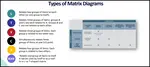
Matrix diagram
Learn the different types of matrix diagram which is a key quality tool.
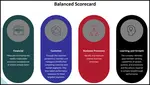
Balanced Scorecard
The Balanced Scorecard provides a clear prescription as to what companies should measure in order to 'balance' the financial perspective
Customer Lifetime Value The Key
Customer lifetime value the key to understanding how much to invest into customer retention. Download a free spreadsheet for calculating LTV.
Basic Tools for Process Improvement
Do you need a list of basic tools for process improvement? We provides a list of basic, advanced and favorite continuous improvement tools.
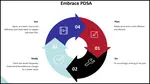
PDCA cycle
Learn the PDCA cycle, when to use it, how to construct it. We include an example of it too.


 |
Software, Videos, Manuals, On-Line Certifications | |
 |
450+ Editable Slides with support links | |
|
|
Corrective Action Software | |
 |
Plan and Track Training | |
 |
AQL Inspection Software | |
 |
Learn and Train TRIZ |