Priorities Matrix

Description:
A priorities matrix evaluates and prioritizes a list of options. The team first establishes a list of weighted criteria and then evaluates each option against those criteria. This is a variation of the L-shaped matrix.
When To Use:
- When a list of options must be narrowed to one or a couple of choices.
- When the decision must be made on the basis of several criteria.
Priorities Matrix Construction
1. Brainstorm the evaluation criteria appropriate to the situation. If possible, involve customers in this process.
2. Discuss and refine the list of criteria. From the list, identify any criteria that must be included and then any that should not be included. Reduce the list of criteria to those that the team believes are most important. Tools such as multivoting may be useful here.
3. Based on the criteria importance to the priorities matrix, assign a relative weight to each criterion. Do this by distributing 10 points among the criteria. Assign the points by discussion and consensus. Another possibility; have each member assign weights, then totaled the numbers for each criterion.
4. Draw an L-shaped priorities matrix. Write the criteria and their weights as labels along one edge and the list of options along the other edge. Usually, whichever group has fewer items occupies the vertical edge.
5. Evaluate each choice against the criteria. There are three ways to do this:

SWOT Manager lets you manage and quickly create your brainstorm SWOTs. Compare the past and track the future.
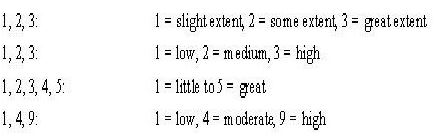
Method 1: Establish a rating scale for each criterion. Make sure that your rating scales are consistent. Word your criteria and set the scales so that the high end of the scale (9 or 1) is always the rating that would tend to make you select that option. The scale should reflect impact on customers, greatest importance, least difficulty, and greatest likelihood of success.
Method 2: This may be the best method for an indiviual ranking when there is no group. For each item on the list of the priorities matriax, rank-order all critreia on how well that critieria meets the each item.
Method 3: Establish a baseline, which may be one of the alternatives or the current product or service then rank all the others. For each criterion in the priorities matrix, rate each other alternative in comparison to the baseline, using scores of worse (-1), same (0), or better (+1). Finer rating scales can be used, such as 2, 1, 0, –1, –2 for a five-point scale or 3, 2, 1, 0, -1, -2, -3 for a seven-point scale. Be sure that positive numbers reflect desirable ratings.
After establishing the weight and rating then multiply these together. Add the points for each option. The option with the highest score will not necessarily be the one to choose, but the relative scores can generate meaningful discussion and lead the team toward consensus

Learn SPC in an hour. Train your employees. Improve your processes and products. Prevent defects and save your company money.
Example
Figure below shows a priorities matrix used by a customer service team at a restaurant to decide which aspect of the overall problem of "long wait time" to tackle first.
The problems they identified are customers waiting for the host, the waiter, the food, and the check.
The scaling criteria they identified are "Customer pain" (how much does this negatively affect the customer?), "Ease to solve", "Effect on other systems", and "Speed to solve".
Originally, the criteria "Ease to solve" was written as "Difficulty to solve", but that wording reversed the rating scale. With the current wording, a high rating on each criterion defines a state that would encourage selecting the problem: Preferably we want to focus on issues that are high customer pain, very easy to solve, high effect on other systems, and quick solution.
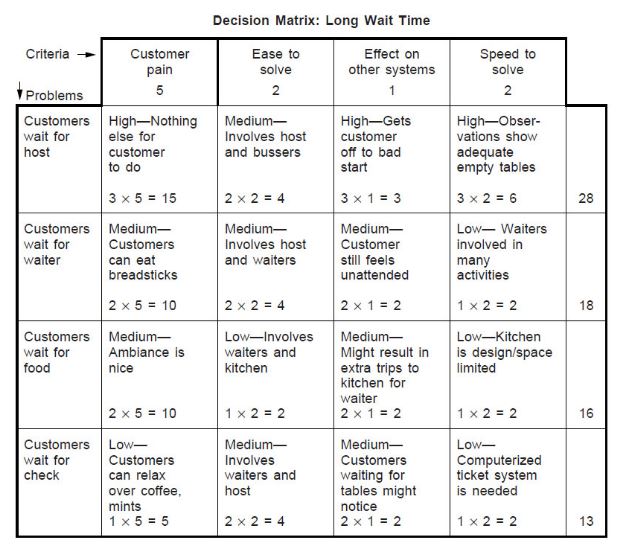
"Customer pain" has been weighted with 5 points, showing that the team considers it by far the most important criterion, compared to 1 or 2 points for the others.
The team chose a rating scale of high = 3, medium = 2, and low = 1. Let's look at the problem "Customers wait for food." The customer pain is medium (2), because the restaurant ambiance is nice. This problem would not be easy to solve (low ease = 1), as it involves both waiters and kitchen staff. The effect on other systems is medium (2), because waiters have to make several trips to the kitchen. The problem will take a while to solve (low speed = 1), as the kitchen is cramped and inflexible. (Notice that this has forced a guess about the ultimate solution: kitchen redesign. This may or may not be a good guess.)
Each rating is multiplied by the weight for that criterion. For example, "Customer pain" (weight of 5) for "Customers wait for host" rates high (3) for a score of 15. The scores are added across the rows to obtain a total for each problem. "Customers wait for host" has the highest score at 28. Since the next highest score is 18, the host problem probably should be addressed first.

8D Manager Software with 8D, 9D, 5Y and 4M report generator. Your corrective action software for managing, measuring, and reporting issues.
Rules Of Thumb
A very long list of options in a priorities matrix can first be shortened with a tool such as list reduction or multivoting.
Use the priorities matrix to compare opinions. When possible, however, it may be better to utilize previous summarized data the various criteria.
Form Sub-teams to collect data on the various criteria.
Several criteria for selecting a problem or improvement opportunity require guess-estimates about the ultimate solution. For example: evaluating resources required, payback, difficulty to solve, and time required to solve. Therefore, your rating of the options will be only as good as your assumptions about the solutions.
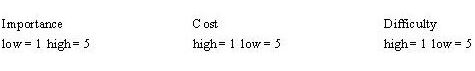
It's critical that the high end of the criteria scale (5 or 1) always is the end you would want to choose. Criteria such as cost, resource use and difficulty can cause mix-ups: low cost is highly desirable! If your rating scale sometimes rates a desirable state as 5 and sometimes as 1, you will not get correct results. You can avoid this by rewording your criteria: Say low cost instead of cost; ease instead of difficulty. Or, in the priorities matrix column headings, write what generates low and high ratings. For example:
When evaluating options by method 1, some people prefer to think about just one option, rating each criterion in turn across the whole matrix, and then doing the next option and so on. Others prefer to think about one criterion, working down the priorities matrix for all options, then going on to the next criterion. Ask your team and then take their pick.
If individuals on the team assign different ratings to the same criterion, discuss this so people can learn from each other’s views and arrive at a consensus.
In some versions of this tool, the sum of the unweighted scores is also calculated and both totals are studied for guidance toward a decision.
When using this tool choose a plan, solution, or new product, results can be used to improve options. An option that ranks highly overall but has low scores on criteria A and B can be modified with ideas from options that score well on A and B. This combining and improving can be done for every option, and then the priorities matrix used again to evaluate the new options.
Criteria often used, usually fall under the general categories of effectiveness, feasibility, capability, cost, time required, support or enthusiasm. Here are other commonly used criteria:

Get certified in Risk Management through our completely on-line training system. Study at your own pace.
Criterial For Selecting A Problem Or An Improvement Opportunity:
- Within control of the team
- Financial payback
- Resources required (for example; money and people)
- Customer pain caused by the problem
- Urgency of problem
- Team interest or buy-in
- Effect on other systems
- Management interest or support
- Difficulty of solving
- Time required to solve
Criteria For Selecting A Solution:
- Root causes addressed by this solution
- Extent of resolution of problem
- Cost to implement (for example, money and time)
- Return on investment; availability of resources (people, time)
- Ease of implementation
- Time until solution is fully implemented
- Cost to maintain (for example, money and time)
- Ease of maintenance
- Support or opposition to the solution
- Enthusiasm by team members
- Team control of the solution
- Safety, health, or environmental factors
- Training factors
- Potential effects on other systems
- Potential effects on customers or suppliers
- Value to customer
- Problems during implementation
- Potential negative consequences
More Info
Fishbone Template Problems and Downloads
This page discusses how to improve the fishbone template, documents problems with the fishbone diagram template and fishbone charts.
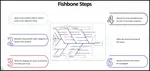
Fish Bone
Learn the steps to create a Fish Bone diagram.
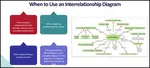
Interrelationship Diagram
Learn the steps to create an interrelationship diagram. Article also provides insight on when to use it too.
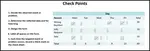
Check Points
Review this procedure creating check points, a continuous improvement tool. We include an example of a tally sheet too.
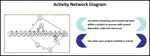
Details on Activity Network Diagram
The what, when, how and why of Activity Network Diagram
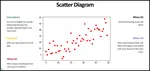
Scatter Diagram
Use a Scatter Diagram to investigate possible relationships. This article provides step by step instructions to creating one
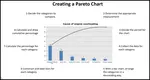
Pareto Chart
The Pareto chart is one of the total quality management tools and usually used during the define stage in six sigma
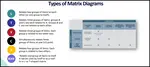
Matrix diagram
Learn the different types of matrix diagram which is a key quality tool.
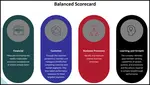
Balanced Scorecard
The Balanced Scorecard provides a clear prescription as to what companies should measure in order to 'balance' the financial perspective
Customer Lifetime Value The Key
Customer lifetime value the key to understanding how much to invest into customer retention. Download a free spreadsheet for calculating LTV.
Basic Tools for Process Improvement
Do you need a list of basic tools for process improvement? We provides a list of basic, advanced and favorite continuous improvement tools.
PDCA cycle
Learn the PDCA cycle, when to use it, how to construct it. We include an example of it too.


 |
Software, Videos, Manuals, On-Line Certifications | |
 |
450+ Editable Slides with support links | |
|
|
Corrective Action Software | |
 |
Plan and Track Training | |
 |
AQL Inspection Software | |
 |
Learn and Train TRIZ |