Activity Network Diagram Definition

Description : An Activity Network Diagram is also called: arrow diagram, network diagram, activity chart, node diagram, CPM (critical path method) chart or PERT (program evaluation and review technique) chart .
When To Use:
When scheduling and monitoring tasks within a project or process with several dependent tasks and resources.
When your project schedule is critical. You foretell serious consequences for completing the project late or a significant advantage to completing the project early.

8D Manager Software with 8D, 9D, 5Y and 4M report generator. Your corrective action software for managing, measuring, and reporting issues.
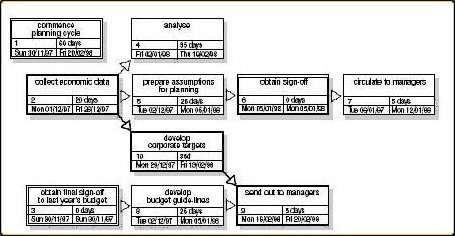
Drawing The Activity Network Diagram Example:
- List all the necessary tasks in the project or process. You can write each task on the top half of a note-card or a sticky note. Then across the middle of the card, draw a horizontal arrow pointing right.
- Determine the correct sequence of the tasks. Do this by asking three questions for each task: Which tasks must happen before this one begins? Which tasks can be done at the same time as this one? Which tasks happens immediately after this one? It can be useful to create a table with four columns prior tasks, this task, simultaneous tasks, following tasks.
- Diagram the network of tasks. If you are using sticky notes or note-cards, arrange them in sequence on a large piece of paper. For the activity network diagram
example, time should flow from left to right and concurrent tasks should be vertically aligned. Leave space between the cards.
- Between each two tasks, draw circles for events. An event marks the beginning or end of a task. Thus, events are nodes that separate tasks.
- Look for the three common problem situations noted below. Redraw them using dummies or extra events. Characterize a dummy with a dotted line arrow. Dummies are not real tasks.
Problem Situations:
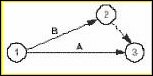
Two simultaneous tasks start and end at the same events.
Solution: Use a dummy and an extra event to separate them. Here event 2 and the dummy between 2 and 3 have been added to separate tasks A and B.
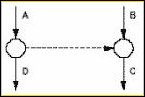
Task C cannot start until both tasks A and B are complete; a fourth task, D, cannot start until A is complete, but need not wait for B.
Solution: Use a dummy between the end of task A and the beginning of task C.
8D Manager Software with 8D, 9D, 5Y and 4M report generator. Your corrective action software for managing, measuring, and reporting issues.
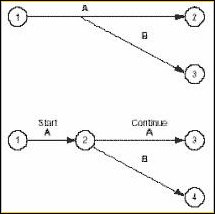
A second task can be started before part of a first task is done.
Solution: Add an extra event where the second task can begin and use multiple arrows to break the first task into two subtasks. Here event 2 was added, splitting task A.
7. Determine task times the best estimate of the time that each task should require. Use one measuring unit (hours, days or weeks) throughout, for consistency. Write the time on each tasks arrow.
8. Within the Activity Network Diagram determine the critical path, the longest path from the beginning to the end of the project. Mark the critical path with a heavy line or color. Calculate the length of the critical path: the sum of all the task times on the path.
9. Calculate the earliest times each task can start and finish, based on how long preceding tasks take.
These are called earliest start (ES) and earliest finish (EF).
Start with the first task, where ES = 0, and work forward.
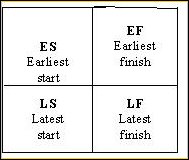
Finish the Activity Network Diagram by drawing a square divided into four quadrants, as in Figure 4. Write the ES in the top left box and the EF in the top right.
8D Manager Software with 8D, 9D, 5Y and 4M report generator. Your corrective action software for managing, measuring, and reporting issues.
For each task:
o Earliest start (ES) = the largest EF of the tasks leading into this one
o Earliest finish (EF) = ES + task time for this task
More Info
Fish Bone
Learn the steps to create a Fish Bone diagram.
Interrelationship Diagram
Learn the steps to create an interrelationship diagram. Article also provides insight on when to use it too.
Fishbone Template Problems and Downloads
This page discusses how to improve the fishbone template, documents problems with the fishbone diagram template and fishbone charts.
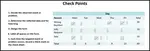
Check Points
Review this procedure creating check points, a continuous improvement tool. We include an example of a tally sheet too.
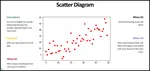
Scatter Diagram
Use a Scatter Diagram to investigate possible relationships. This article provides step by step instructions to creating one
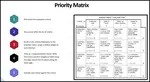
Priorities Matrix
A priorities matrix evaluates and prioritizes a list of options. Learn to formally construct one and analyze the results.
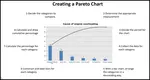
Pareto Chart
The Pareto chart is one of the total quality management tools and usually used during the define stage in six sigma
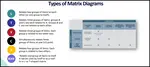
Matrix diagram
Learn the different types of matrix diagram which is a key quality tool.
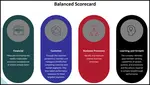
Balanced Scorecard
The Balanced Scorecard provides a clear prescription as to what companies should measure in order to 'balance' the financial perspective
Basic Tools for Process Improvement
Do you need a list of basic tools for process improvement? We provides a list of basic, advanced and favorite continuous improvement tools.
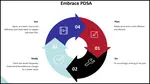
PDCA cycle
Learn the PDCA cycle, when to use it, how to construct it. We include an example of it too.
Customer Lifetime Value The Key
Customer lifetime value the key to understanding how much to invest into customer retention. Download a free spreadsheet for calculating LTV.


 |
Software, Videos, Manuals, On-Line Certifications | |
 |
450+ Editable Slides with support links | |
|
|
Corrective Action Software | |
 |
Plan and Track Training | |
 |
AQL Inspection Software | |
 |
Learn and Train TRIZ |