Interrelationship Diagram
Description of the Interrelationship Diagram
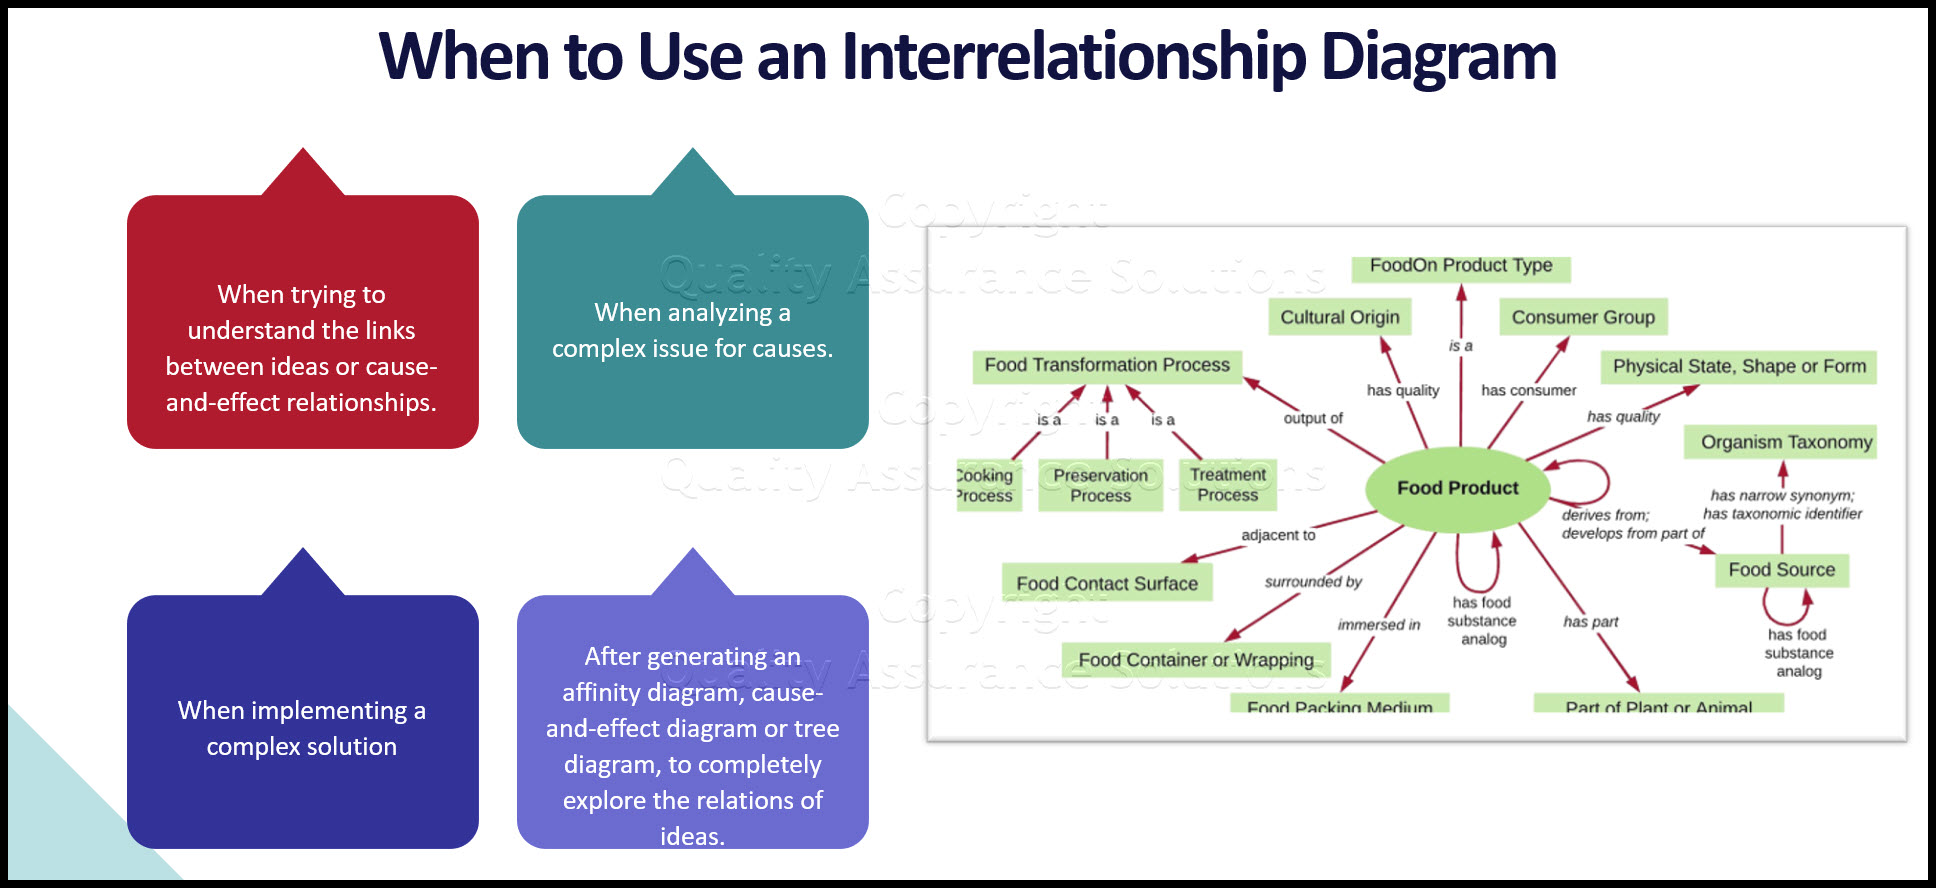
The Interrelationship diagram shows cause-and-effect relationships. Just as importantly, the process of creating an interrelationship diagram helps a team analyze the natural links between the different aspects of a complex situation.
When to Use:
- When trying to understand the links between ideas or cause-and-effect relationships, such as identifying the area of greatest impact for improvement.
- When analyzing a complex issue for causes.
- When implementing a complex solution.
- After generating an affinity diagram, cause-and-effect diagram or tree diagram, to completely explore the relations of ideas.
Interrelationship Diagram Construction:
Gather sticky notes or cards, large paper surface (newsprint or two flip chart pages taped together), marking pens and tape.

Comprehensive ISO 9001:2015 Audit Checklist for Internal, Gap and Certification Audits.
1. Write a statement defining the issue for the relations diagram. Write it on a card or sticky note and place it at the top of the work surface.
2. Brainstorm ideas about the issue and write them on individual cards or notes.
If another tool such as an affinity diagram preceded this one, take the ideas from the affinity diagram or the most detailed row of the tree diagram or the final branches on the fishbone diagram. You may want to use these ideas as starting points and brainstorm additional ideas.
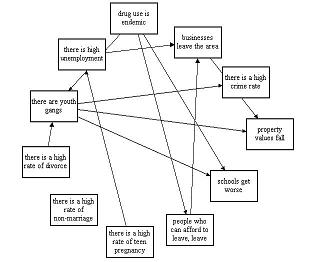
3. Place one idea at a time on the work surface. For each idea, ask: "Is this idea related to any others?" Place ideas that are related together. Leave space between the cards to allow for drawing arrows. Repeat until all cards are on the work surface.
4. For each idea, ask, "Does this idea cause or influence any other idea?" Draw arrows from each idea to the ones it causes or influences. Repeat the question for every idea.
5. Analyze the diagram:
6. Count the arrows in and out for each idea. Write the counts at the bottom of each box. The ones with the most arrows are the key ideas.
7. Note which ideas have primarily outgoing (from) arrows. These are the basic causes.
8. Note which ideas have primarily incoming (to) arrows. These are final effects that also may be critical to address.
More Info
Fish Bone
Learn the steps to create a Fish Bone diagram.
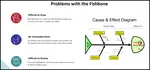
Fishbone Template Problems and Downloads
This page discusses how to improve the fishbone template, documents problems with the fishbone diagram template and fishbone charts.
Check Points
Review this procedure creating check points, a continuous improvement tool. We include an example of a tally sheet too.
Details on Activity Network Diagram
The what, when, how and why of Activity Network Diagram


Scatter Diagram
Use a Scatter Diagram to investigate possible relationships. This article provides step by step instructions to creating one
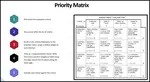
Priorities Matrix
A priorities matrix evaluates and prioritizes a list of options. Learn to formally construct one and analyze the results.
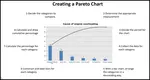
Pareto Chart
The Pareto chart is one of the total quality management tools and usually used during the define stage in six sigma
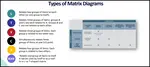
Matrix diagram
Learn the different types of matrix diagram which is a key quality tool.
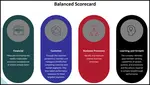
Balanced Scorecard
The Balanced Scorecard provides a clear prescription as to what companies should measure in order to 'balance' the financial perspective

Basic Tools for Process Improvement
Do you need a list of basic tools for process improvement? We provides a list of basic, advanced and favorite continuous improvement tools.
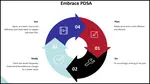
PDCA cycle
Learn the PDCA cycle, when to use it, how to construct it. We include an example of it too.
Customer Lifetime Value The Key
Customer lifetime value the key to understanding how much to invest into customer retention. Download a free spreadsheet for calculating LTV.


 |
Software, Videos, Manuals, On-Line Certifications | |
 |
450+ Editable Slides with support links | |
 |
Corrective Action Software | |
 |
Plan and Track Training | |
 |
AQL Inspection Software | |
 |
Learn and Train TRIZ |