Scatter Diagram
Description:
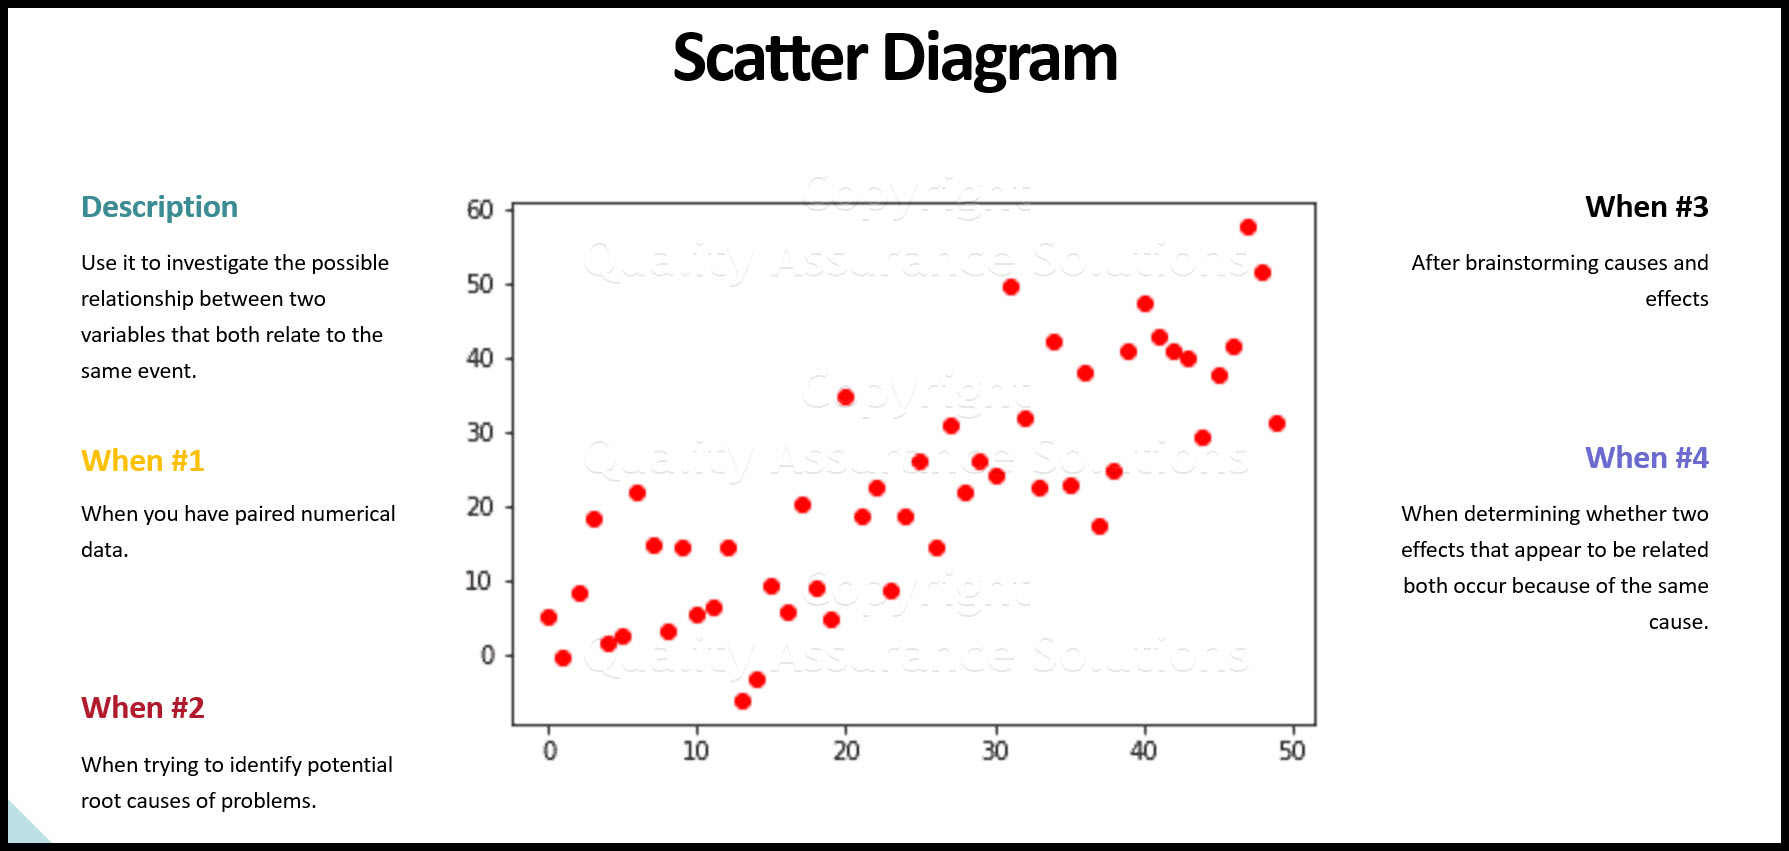
Use a Scatter Diagram to investigate the possible relationship between two variables that both relate to the same event.
When To Use:
When you have paired numerical data.
When trying to identify potential root causes of problems.
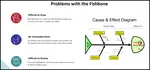
After brainstorming causes and effects using a fishbone diagram. To objectively determine the relationship between a particular cause and effect.
When determining whether two effects that appear to be related both occur because of the same cause.

8D Manager Software with 8D, 9D, 5Y and 4M report generator. Your corrective action software for managing, measuring, and reporting issues.
Making a Scatter Diagram
1. Collect pairs of data where a relationship is suspected.
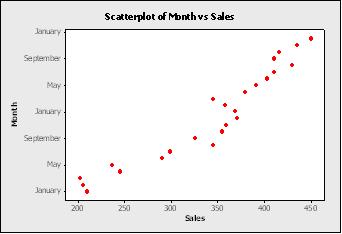
2. Draw the scatter diagram with the independent variable on the horizontal axis and the dependent variable on the vertical axis. For each pair of data, put a dot or a symbol where the x-axis value intersects the y-axis value. (If two dots fall together, put them side by side, touching, so that you can see both.)
3. As in the below graph, Look at the pattern of points for a obvious relationship. If the data clearly form a line or a curve, you may stop. The variables are correlated. You may wish to use regression or correlation analysis now. Otherwise, complete steps 4 through 7.
4. Divide points on the graph into four quadrants. Let X be the number of points on the graph.
5. Count X/2 points from top to bottom and draw a horizontal line.
6. Count X/2 points from left to right and draw a vertical line.
7. If number of points is odd, draw the line through the middle point.
8. Count the points in each quadrant. Do not count points on a line.
9. Add the diagonally opposite quadrants. Find the smaller sum and the total of points in all quadrants.
10. A = points in upper left + points in lower right
11. B = points in upper right + points in lower left
12. Q = the smaller of A and B
13. N = A + B
14. Look up the limit for N on the below trend test scatter diagram table.
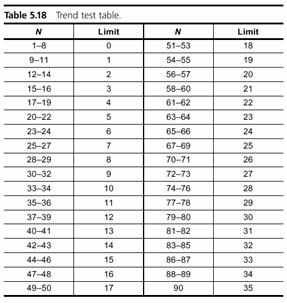
15. If Q is less than the limit, the two variables are related.
16. If Q is greater than or equal to the limit, the pattern occurred from random chance.
If you want to see how regression relates to the scatter diagram, see this page.
More Info
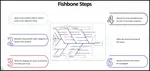
Fish Bone
Learn the steps to create a Fish Bone diagram.
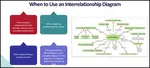
Interrelationship Diagram
Learn the steps to create an interrelationship diagram. Article also provides insight on when to use it too.
Fishbone Template Problems and Downloads
This page discusses how to improve the fishbone template, documents problems with the fishbone diagram template and fishbone charts.
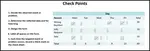
Check Points
Review this procedure creating check points, a continuous improvement tool. We include an example of a tally sheet too.
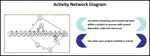
Details on Activity Network Diagram
The what, when, how and why of Activity Network Diagram
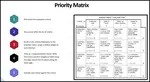
Priorities Matrix
A priorities matrix evaluates and prioritizes a list of options. Learn to formally construct one and analyze the results.
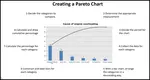
Pareto Chart
The Pareto chart is one of the total quality management tools and usually used during the define stage in six sigma
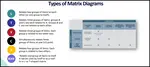
Matrix diagram
Learn the different types of matrix diagram which is a key quality tool.
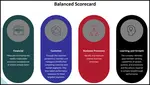
Balanced Scorecard
The Balanced Scorecard provides a clear prescription as to what companies should measure in order to 'balance' the financial perspective
Basic Tools for Process Improvement
Do you need a list of basic tools for process improvement? We provides a list of basic, advanced and favorite continuous improvement tools.
PDCA cycle
Learn the PDCA cycle, when to use it, how to construct it. We include an example of it too.
Customer Lifetime Value The Key
Customer lifetime value the key to understanding how much to invest into customer retention. Download a free spreadsheet for calculating LTV.


 |
Software, Videos, Manuals, On-Line Certifications | |
 |
450+ Editable Slides with support links | |
|
|
Corrective Action Software | |
 |
Plan and Track Training | |
 |
AQL Inspection Software | |
 |
Learn and Train TRIZ |