Value Stream Mapping
Value stream mapping is a visual diagram that represents the activities to produce a product or service through the design, source, make, and deliver functions. Creating a value stream is the first step required in any lean improvement initiative.
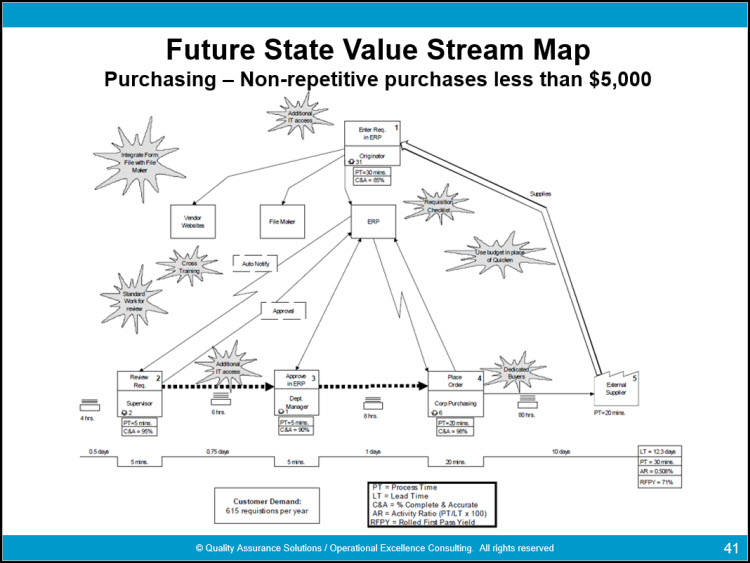
One uses this tool to graphically represent the current state of a process. The graph includes icons to show the sequence of materials, processes, and information for the specific process.
The map shows two main components. The value stream illustruates the flow of materials through the transformation processes to produce the finished goods or services. The map also documents the flow of information to support the transformation process for the finished goods or services. If you leave off the information flow, you limited the benefit of the value map.
8D Manager Software with 8D, 9D, 5Y and 4M report generator. Your corrective action software for managing, measuring, and reporting issues.
With the map you can identify waste and then determine the process's future afte the elimination of the non value added steps. Combine the map with the lean principles and lean tools to truly transform the enterprise and achieve improvement. Think about the map's visible opportunities to drive out waste and the resulting significant positive impact on the financial performance for the enterprise and all stake-holders.
It is not uncommon for a specific value stream to yield 5% value-added content to 95% non-value-added content.
Value Stream Mapping lets you...
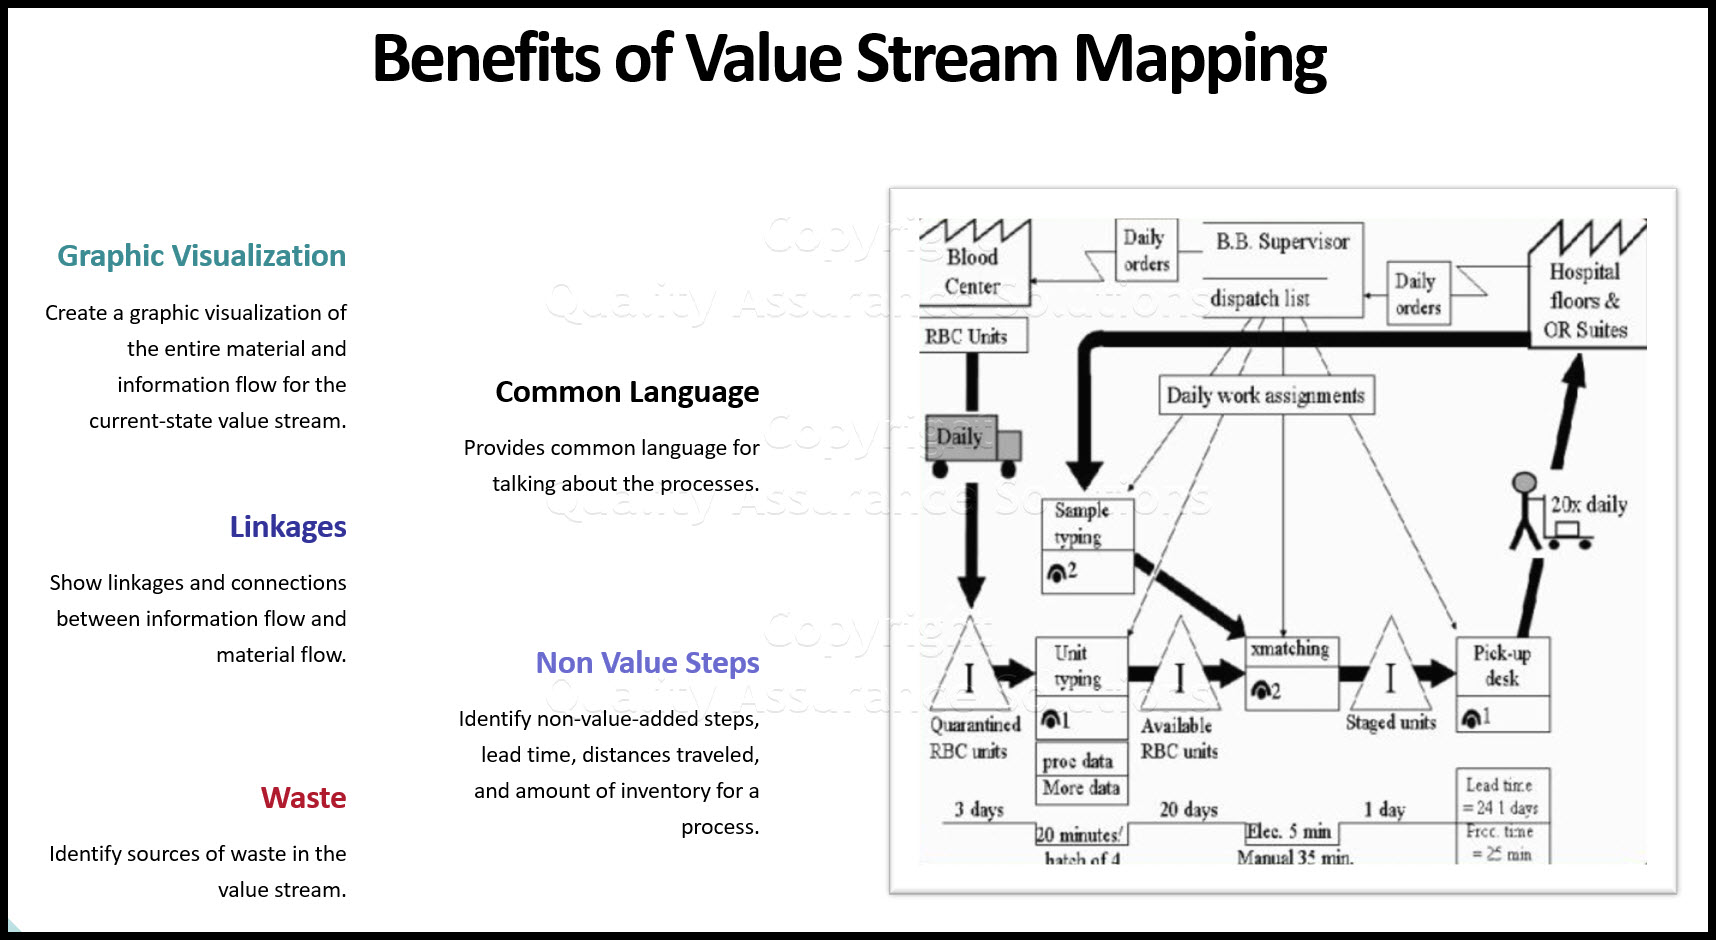
- Create a graphic visualization of the entire material and information flow for the current-state value stream.
- Show linkages and connections between information flow and material flow.
- Identify sources of waste in the value stream.
- Provide common language for talking about the processes.
- Make decisions about the apparent flow.
- Form the basis of an implementation plan to identify and eliminate wastes.
- Identify non-value-added steps, lead time, distances traveled, and amount of inventory for a process.
- Provide a common language for discussing the future-state value stream and identifying gaps between the current state and future state.
An Example
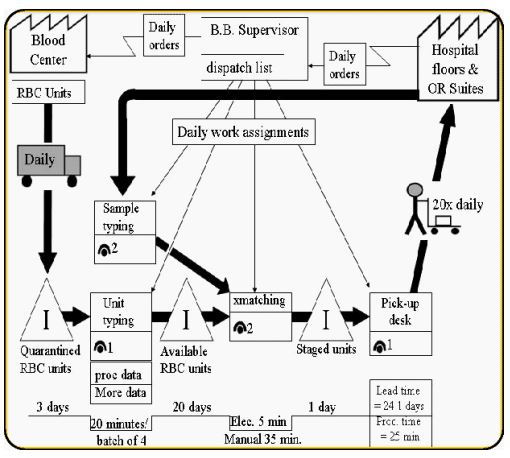
An example of a process map for blood bank operations is shown below.
|
Quality Assurance Solutions Robert Broughton (805) 419-3344 USA |
 |
|
Software, Videos, Manuals, On-Line Certifications | ||
|
450+ Editable Slides with support links | ||
|
Corrective Action Software | ||
|
Plan and Track Training | ||
|
AQL Inspection Software |
|
Learn and Train TRIZ | ||
|
Editable Template | ||
|
Templates, Guides, QA Manual, Audit Checklists | ||
|
EMS Manual, Procedures, Forms, Examples, Audits, Videos | ||
|
On-Line Accredited Certifications Six Sigma, Risk Management, SCRUM | ||
|
Software, Videos, Manuals, On-Line Certifications |
