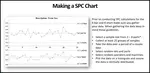
Statistical Process Control (SPC)

Statistical Process Control (SPC) is a special tool that helps control a process. For Six Sigma methodology, we use this tool in the measure phase and the control phase
To understand Statistical Process Control (SPC) you need to understand the different types of variation in a process.
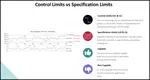
Common Cause. The inherent variation present in every process. This process background can only be removed or lessened by a fundamental change in the process, such as the process's physics, chemistry, or technology. A process is stable, predictable, and in-control when only common cause variation exists in the process.
Special Cause. The unpredictable variation in a process caused by a unique disturbance or a series of them. Special cause variation is typically larger than common cause variation. It is not part of the underlying physics of the process and can be removed or lessened by basic process control and monitoring. A process exhibiting special cause variation is said to be out-of-control and unstable.
You use control charts to find the signals of special cause variation among all of the background noise. Once detecting an event, you take action to identify and remedy the cause. Without these controlling actions your process can drift and cause detrimental harm to your product.

Learn SPC in an hour. Train your employees. Improve your processes and products. Prevent defects and save your company money.
Roadmap
The below roadmap provides a general flow for implementing SPC. If you would like a more detail approach, we recommend purchasing this SPC class. The hour long SPC class provides all the math and plenty of examples.
Step 1.
Identify the critical control measurements using SPC. Choose the measurement (X) based on the following.
- Critical measurement of the process
- Cannot be designed out of the process.
- Cannot be controlled by physical methods.
- Cannot be controlled using mistake-proofing devices.
- Measurable on a continuous or attribute scale.
Step 2.
From the data type of the X (Continuous or Attribute) determine the specific type of Control Chart.
Step 3.
Use a sample of recent historical data to form a baseline chart. If none is available, then create a blank chart and populate it as data becomes available. Do not invent the control limits. The process determines these.
Step 4.
Determine the required actions if the process shows an out-of-control condition. This could have been already determined earlier in a Failure Mode & Effects Analysis.
Step 5.
Train the Operators on how to read the chart and thier actions if the process goes out of control.
Step 6.
Transfer ownership of the chart to the operators or line supervisor. Hold operators or supervisors (as per Step 6) accountable
Step 7.
Update all procedures and job descriptions to include accountability for the charts.
Learn SPC in an hour. Train your employees. Improve your processes and products. Prevent defects and save your company money.
Interpreting The Output
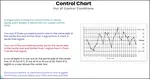
As mentioned previously, SPC detects when an out of the ordinary event occurs. Control Charts typically take the form shown below. Data is plotted over time across the x-axis, with the height on the y-axis representing the measurement.
From the data in the chart, the control limits represents the boundaries of reasonable behavior within the process. We consider a point landing outside of these boundaries as a special cause (out of the ordinary).
Structure Of A Control Chart.
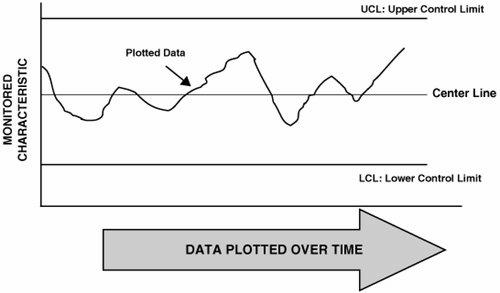
Analysis of a Normal Distribution shows that approximately 99.73% of all data points should fall between these lines. Statistical software generally highlights other unusual points for instances such as:
- Points hugging the center line
- Points oscillating back and forth
- Points continuously rising or falling
Learn SPC in an hour. Train your employees. Improve your processes and products. Prevent defects and save your company money.
Statistical Process Control Mistakes
Drawing product specification limits on the control chart. This causes the chart to become just an inspection tool. Operators tend to focus only on the specification limits and ignore the control limits. Further with so many lines, the chart becomes incomprehensible and the operator completely ignores the data.
Treating control limits as specification limits. The Control Limits are not directly tied to customer defects. If a point goes out of control it does not necessarily mean that the entity concerned is defective; it just means that the process has changed.
Flooding the system with control charts, and then not taking action on the data.
Not following up on the unusual negative events to remedy them by determining and eliminating the root causes. In this case there is no "Control" in Statistical Process Control.
Not following up on unusual positive events to learn from them and capture the improvement. Sometimes the process suddenly gets better; for example, the data points might suddenly start hugging the centerline. Even though you feel good about the process improvement, don't forget to capture the improvement and set this as the new standard going forward.
More Info
SPC Help Video
Download Today. The number one mistake company’s make when implementing SPC is not training their employees in SPC. Maximize your SPC efforts! Get SPC help. Use this SPC Training Video to quickly train your staff. $69.00. Satisfaction guaranteed.
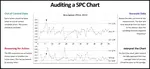
Auditing SPC inspection
Learn to audit your SPC inspection program. This article covers SPC technology keys such as documentation, training, reviewing, and process improvement.
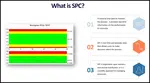
SPC definition
Here we discuss the SPC definition. We describe the charts and the meaning of "special cause variation". Read more...
SPC Calculations
Find out how to conduct SPC calculations here. Page discusses SPC limits
Control Chart SPC, Control Charts and limits
Learn about control chart SPC and the differences between process limits and specification. Article includes pictures of these limits with control charts.
Control Charts
Control Charts, Variable data, Attribute data, Variation, Total Quality Management Tool


 |
Software, Videos, Manuals, On-Line Certifications | |
 |
450+ Editable Slides with support links | |
 |
Corrective Action Software | |
 |
Plan and Track Training | |
 |
AQL Inspection Software | |
 |
Learn and Train TRIZ |