Control Charts
Description:
Control charts are graphs used to study how a process changes over time.
Data is plotted in time order. A control chart always has a central line for the average, an upper line for the upper control limit and a lower line for the lower control limit. These three lines are determined from historical data. By comparing current data to these lines, you can draw conclusions about whether the process variation is consistent (in control) or is unpredictable (out of control, affected by special causes of variation).
Learn SPC in an hour. Train your employees. Improve your processes and products. Prevent defects and save your company money.
Variable data uses two control charts. The top chart monitors the average, or the centering of the distribution of data from the process. The bottom chart monitors the range, or the width of the distribution.
If your data were shots in target practice, the average shows the shots clustering. The range shows how tight they are clustered.
When To Use:
- When controlling ongoing processes by finding and correcting problems as they occur.
- When predicting the expected range of outcomes from a process.When determining whether a process is stable (in statistical control).
- When analyzing patterns of process variation from special causes (non-routine events) or common causes (built into the process).
- When determining whether your quality improvement project should aim to prevent specific problems or to make fundamental changes to the process.
Basic Procedure:
1. Choose the appropriate control chart for your data.
2. Determine the appropriate time period for collecting and plotting data.
3. Collect data, construct your chart and analyze the data.
4. Look for out-of-control signals on the control chart. When one is identified, mark it on the chart and investigate the cause. Document how you investigated, the root cause and how it was corrected.
Learn SPC in an hour. Train your employees. Improve your processes and products. Prevent defects and save your company money.
Out-Of-Control Signals
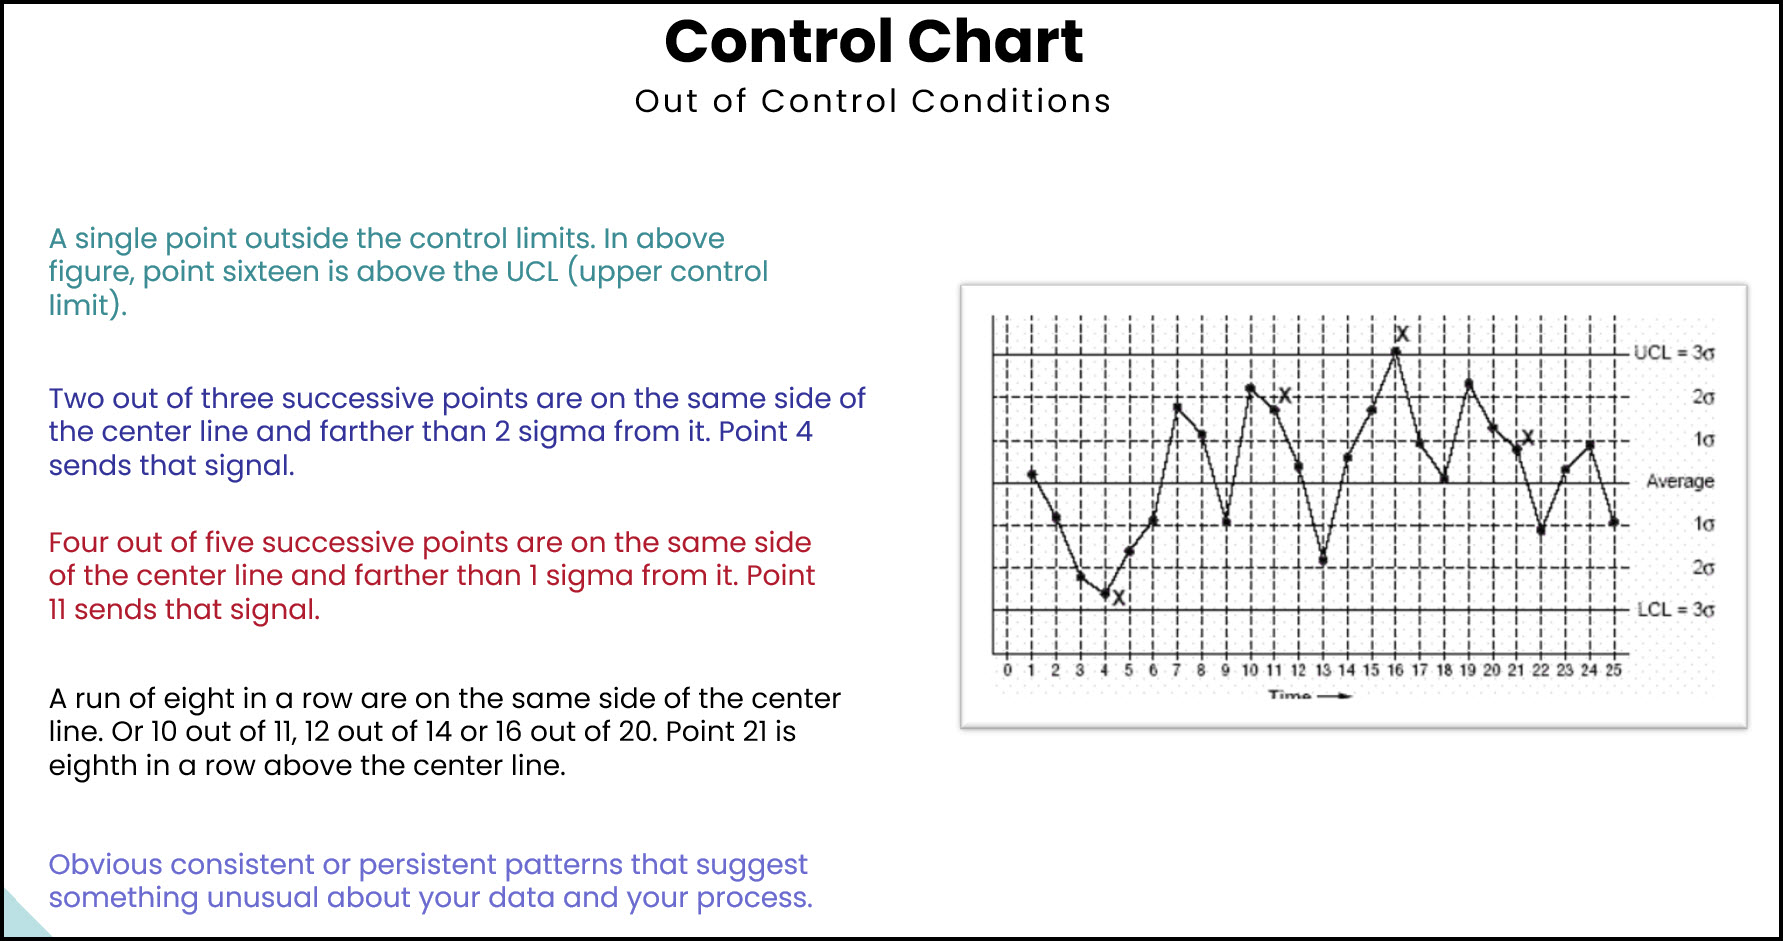
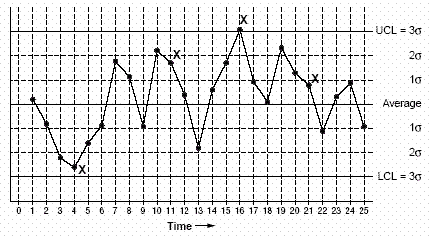
- A single point outside the control limits. In above figure, point sixteen is above the UCL (upper control limit).
- Two out of three successive points are on the same side of the center line and farther than 2 sigma from it. Point 4 sends that signal.
- Four out of five successive points are on the same side of the center line and farther than 1 sigma from it. Point 11 sends that signal.
- A run of eight in a row are on the same side of the center line. Or 10 out of 11, 12 out of 14 or 16 out of 20. Point 21 is eighth in a row above the center line.
- Obvious consistent or persistent patterns that suggest something unusual about your data and your process.
- Continue to plot data as you collect data. As each new data point is plotted, check for new out-of-control signals.
- When you start a new control chart, the process may be out of control. If so, the control limits calculated from the first 20 points are conditional limits. When you have at least 20 sequential points within control, recalculate the control limits.
Different Types Of Control Charts
The the type of chart depends on your measurement data. The two broadest groupings are for variable data and attribute data.
- Variable data are measured on a continuous scale. For example: time, weight, distance or temperature can be measured in fractions or decimals. The possibility of measuring to greater precision defines variable data.
- Attribute data are counted and cannot have fractions or decimals. Attribute data arise when you count the presence or absence of something: success or failure, accept or reject, correct or not correct. For example, a report can have four errors or five errors, but it cannot have four and a half errors.
Learn SPC in an hour. Train your employees. Improve your processes and products. Prevent defects and save your company money.
Types Of Variables Charts:
- X and R chart (also called average and range chart)
- X and S chart
- Chart of individuals (also called X chart, X-R chart, IX-MR chart, Xm R chart, moving range chart)
- Moving average moving range chart (also called MAMR chart)
- Target charts (also called difference charts, deviation charts and nominal charts)
- CUSUM (also called cumulative sum chart)
- EWMA (also called exponentially weighted moving average chart)
- Multivariate chart (also called Hotelling T2)
Types Of Attributes Charts
- p chart (also called proportion chart)
- np chart
- c chart (also called count chart)
- u chart
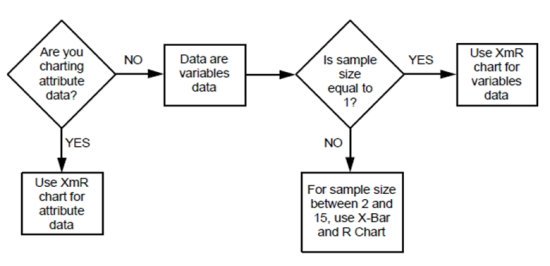
How To Choose Control Chart
|
Quality Assurance Solutions Robert Broughton (805) 419-3344 USA |
 |
|
Software, Videos, Manuals, On-Line Certifications | ||
|
450+ Editable Slides with support links | ||
|
Corrective Action Software | ||
|
Plan and Track Training | ||
|
AQL Inspection Software |
|
Learn and Train TRIZ | ||
|
Editable Template | ||
|
Templates, Guides, QA Manual, Audit Checklists | ||
|
EMS Manual, Procedures, Forms, Examples, Audits, Videos | ||
|
On-Line Accredited Certifications Six Sigma, Risk Management, SCRUM | ||
|
Software, Videos, Manuals, On-Line Certifications |


