Data Analysis Techniques

When you understand data analysis techniques, you take a big step towards making product and process improvements. How do you know when you implement a change, that the change was effective?
The Problem
Have you ever encountered a manager who said “I just made a change to the way we do things here. Now things are better.”? When you review the final outcome, you find things are not improved. In fact the improvements may be counter productive. Why did the manager make these statements?
- The manager’s ego may prevent him / her from realizing the change was not effective.
- There may not be any measurements in place to monitor the change.
- The measurement may be on the wrong item. In this case, your point of view is different then your manager’s point of view.
- The data is collected correctly but your manager is not reviewing the data. The data is not being analyzed.
- The manager does not understand the definition of improvement. When you say improvement what does that mean? How does data analysis link to improvement?

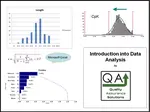
This Data Analysis Video teaches you the basic tools for understanding, summarizing, and making future predictions with your collected data. Includes MS Excel templates.
The Answer
Now you realized things did not improve. How can you prove to your manager and others that things are not improved? A discussion without data is a wasted conversation. In fact approaching others without data could lead to unwanted arguments. Understanding data analysis techniques avoids he said - she said arguments.
With data, your armed with tools to support your case. When you present your data in pictures, such as histograms and pareto charts, you support your line of reasoning. Logical management understands these tools and sound rational changes are implemented.
Your Training in Data Analysis Techniques
You can learn these tools and start using them within one hour. The introduction into data analysis video provides basic data analysis techniques. Learn how data links with improvement. Learn the key statistics that drives improvement. Learn how to present data in easy to review formats. Prevent undesired arguments. Help yourself and management to focus on the important measurements. To make you effective, this training video shows you to use Microsoft Excel to quickly conduct data analysis.
To learn data analysis techniques, you do not need an advance degree. If you can add and subtract, you can learn data analysis. This class teaches the key ideas to data analysis. The class condenses 8 hours of material into 1 hour. But it does not over load the student. The course simplifies the concepts and provides many examples.
Best of all, you can learn it at your computer. No need for travel. No need for unnecessary expenses. You take it at your convenience.
This Data Analysis Video teaches you the basic tools for understanding, summarizing, and making future predictions with your collected data. Includes MS Excel templates.
What is Data Collection for Data Analysis Techniques
Data Collection helps your team to assess the health of your process. To do so, you identify the key quality characteristics you will measure, how you will measure them, and what you will do with the collected data
What Exactly is a Key Quality Characteristic?
It is a feature of the product or service produced by a process that
customers have determined is important to them. Every product or service
has multiple key quality characteristics. Key quality characteristics
include such things as the speed of a service, the finish on a set of
stainless steel shelves, the precision of an electronic component, or
the effectiveness of an administrative response.
When you
select processes to improve, you need to find the process step that
produce the characteristics your customers perceive as important to
product quality. Collecting data is nothing more than planning and
gathering useful information on key quality characteristics produced by
your process.
However, simply collecting data does not ensure you obtain the relevant or specific enough data that reflects your process. The key issue is not...How do we collect data? Rather, it is...How do we collect useful data?
This Data Analysis Video teaches you the basic tools for understanding, summarizing, and making future predictions with your collected data. Includes MS Excel templates.
Why Do We Need to Collect Data?
Every process improvement effort relies on data to provide a factual basis for making decisions throughout the Plan-Do-Check-Act cycle.
Gathering data enables a team to formulate and test working assumptions about a process. This information leads to the improvement of the product or service. Data improves your decision-making by helping you focus on objective information that describes the process, rather than subjective opinions. In other words, the phrase "I think the problem is..." becomes... "The data indicate the problem is..." .
Defined Your Data Collecting Process.
For your team to collect data uniformly, you need to develop a data gathering plan. The elements of the plan must be clearly and unambiguously defined operationally defined.
When Should We Develop a Data Collection Plan?
You develop your plan during the first phase of the Plan-Do- Check-Act (PDCA) cycle. The PDCA cycle provides a framework for you to build an understanding of your process. PDCA shows you how to obtain and interpret data that will lead to real process improvement.
More Info
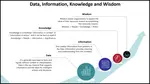
Data and Information
Data and Information, are often used interchangeably, they don’t mean the same thing
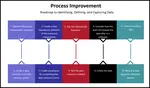
Process Improvement and KPOVs
Lean Sigma is different to many traditional Process Improvement initiatives in its reliance on data to make decisions
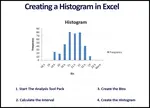
Histogram in Excel
Follow these steps to create a Histogram in Excel. This includes turning on data analysis, creating bins, and sorting data.
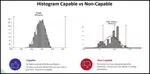
Histogram Examples: A Picture of Your Data
See our histogram examples. We discuss normal distribution and how it applies to quality assurance. Histograms are a key process improvement tool.
Data Analysis Video
Download Today. Don’t take chances without understanding your data. Data drives business decisions. But how does this work? This introduction to Data Analysis Video shows you how to gather, summarize, and present data to management and your team. $69.00. Satisfaction guaranteed.
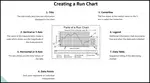
Run Chart
A Run Chart displays the process performance over time. It is a line graph of data points plotted in chronological order. Learn more!
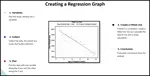
Regression
See our article on regression, includes details, collecting the data, examples, roadmap and possible problems
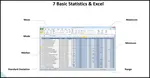
Data analysis in excel
Data analysis in excel discusses calculating averages, ranges, and standard deviation in Microsoft Excel.
Continuous Data
Learn how to evaluate your continuous data and assure satisfactory inspection. Without conducting an MSA on your data set, you put your inspection data at risk.
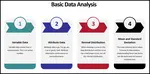
What is Data Analysis? A Tool for Continuous Improvement
What is data analysis? Understanding data is key to continuous improvement, your quality assurance systems and ISO 9001 certification.
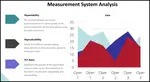
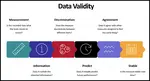
Validity for Measurement Systems
Understand Measurement System Analysis, and we present a road map to apply MSA Validity
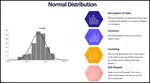
Statistics Normal Distribution Described
Do you know the statistics normal distribution? Normal distrubution is critical to know for your quality assurance program.
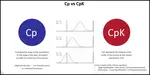
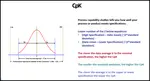
Understand Process Capability
Learn about Process Capability, Process Drift, PpK Vs CpK
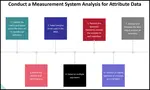
MSA Attribute data
An overview of MSA Attribute data and how MSA data affects your processes
Process Capability Studies
Process capability studies demonstrate the fit of your data to your specifications. Machine process capability determines current and future defects.
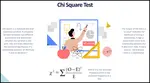
Chi Square
Learn how to apply Chi Square in practice, when to use it , how to insure results
- QAS Home
- Data Analysis
|
Quality Assurance Solutions Robert Broughton (805) 419-3344 USA |
 |


 |
Software, Videos, Manuals, On-Line Certifications | |
 |
450+ Editable Slides with support links | |
 |
Corrective Action Software | |
 |
Plan and Track Training | |
 |
AQL Inspection Software |
 |
Learn and Train TRIZ | |
 |
Editable Template | |
 |
Templates, Guides, QA Manual, Audit Checklists | |
 |
EMS Manual, Procedures, Forms, Examples, Audits, Videos | |
 |
On-Line Accredited Certifications Six Sigma, Risk Management, SCRUM | |
|
|
Software, Videos, Manuals, On-Line Certifications |