SPC Definition

SPC Definition: SPC stands for statistical process control. Statistical Process Control is a scientific visual method used to monitor, control and improve processes by eliminating special cause variation from manufacturing, service and financial processes. SPC is a key continuous improvement tool.
SPC is also a fundamental tool in six sigma methodology.

Learn SPC in an hour. Train your employees. Improve your processes and products. Prevent defects and save your company money.
SPC Chart Described
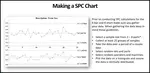
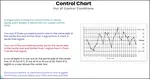
The X bar is the top chart. The cross hairs represent the average over time. The most recent data is on the right hand side of the chart. There is a UC line and an LC line which stands for upper control limit and lower control limit. These limits are calculated based on the overall average of the chart and the average range. In the center of the X bar chart there is an mean line which is the average of all collected data.
The R chart is the bottom chart. The cross hairs represents the range of each data set. They correlate with the cross hairs on the top chart. There is an UC line (and sometimes a LC line) is dependent on the average range of the sample size.
The Y axis for the X bar chart is the average of the sample. The Y axis for the R chart is the number for the range of the sample.
Typically you sample 1 to 8 parts at a set frequency period. You then take the average of the sample size and plot it on the X bar chart. You plot the average in sequence, so the next point will be the furthest to the right. You then take the range of the sample size and plot that on the bottom R chart.
Learn SPC in an hour. Train your employees. Improve your processes and products. Prevent defects and save your company money.
SPC Definition and Special Cause Variation
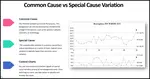
If you study SPC charts you see most of the data is close to the average with some of the data away from the average. The plotted points are random. Half of them are above the average and half of them are below the average. This is the expected look of a chart when the process is in control.
A SPC chart tells you when your process is out of control. Out of control means there is a special cause that was not there before. This could be an operator setup issue, wrong tooling, a change in raw materials or any unusual noise that can be investigated and eliminated.
By knowing the SPC definition and how to use the charts you improve your processes because it directs you to finding problems exactly when they occur. You can eliminate the noise before process significantly changes. This prevents defects from occurring and costing your company serious $$.
Learn SPC in an hour. Train your employees. Improve your processes and products. Prevent defects and save your company money.
More Info
SPC Help Video
Download Today. The number one mistake company’s make when implementing SPC is not training their employees in SPC. Maximize your SPC efforts! Get SPC help. Use this SPC Training Video to quickly train your staff. $69.00. Satisfaction guaranteed.
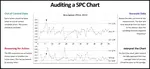
Auditing SPC inspection
Learn to audit your SPC inspection program. This article covers SPC technology keys such as documentation, training, reviewing, and process improvement.
SPC Calculations
Find out how to conduct SPC calculations here. Page discusses SPC limits
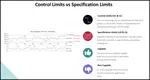
Control Chart SPC, Control Charts and limits
Learn about control chart SPC and the differences between process limits and specification. Article includes pictures of these limits with control charts.
Control Charts
Control Charts, Variable data, Attribute data, Variation, Total Quality Management Tool
statistical process control
This article covers a roadmap for statistical process control. Discusses chart structure and implementation mistakes.
- QAS Home
- SPC
|
Quality Assurance Solutions Robert Broughton (805) 419-3344 USA |
 |


 |
Software, Videos, Manuals, On-Line Certifications | |
 |
450+ Editable Slides with support links | |
 |
Corrective Action Software | |
 |
Plan and Track Training | |
 |
AQL Inspection Software |
 |
Learn and Train TRIZ | |
 |
Editable Template | |
 |
Templates, Guides, QA Manual, Audit Checklists | |
 |
EMS Manual, Procedures, Forms, Examples, Audits, Videos | |
 |
On-Line Accredited Certifications Six Sigma, Risk Management, SCRUM | |
|
|
Software, Videos, Manuals, On-Line Certifications |