SPC Calculations

Prior to conducting SPC calculations for the X bar and R chart make sure you gather your data. When gathering the data keep in mind these guidelines.
- Select a sample size from 2 – 8 parts*.
- Collect at least 25 groups of samples
- Take the data over a period of a couple days
- Select random lots and parts
- Select random operators and machines.
- Plot the data on a histogram and assure the data is normally distributed.
* Do not change the sample size after you start collecting your data and plotting the points.

Learn SPC in an hour. Train your employees. Improve your processes and products. Prevent defects and save your company money.
Limit SPC Calculations
1) For each group of samples calculate the mean and the range.
2) Calculate the overall mean which is know as
3) Calculate the mean of all of the ranges. This is known as
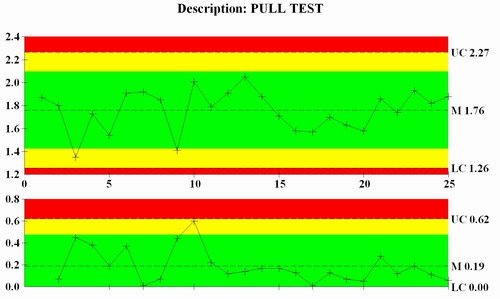
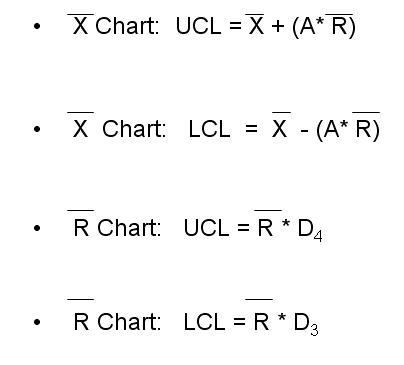
4) Now you are ready to calculate the limits. See below for the equations
Learn SPC in an hour. Train your employees. Improve your processes and products. Prevent defects and save your company money.
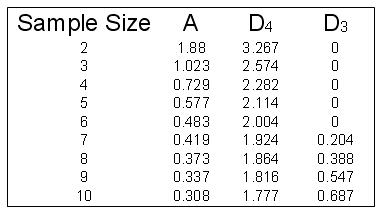
Here is the table for the constants. The constants depend on your sample size.
More Info
SPC Help Video
Download Today. The number one mistake company’s make when implementing SPC is not training their employees in SPC. Maximize your SPC efforts! Get SPC help. Use this SPC Training Video to quickly train your staff. $69.00. Satisfaction guaranteed.
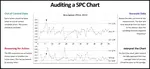
Auditing SPC inspection
Learn to audit your SPC inspection program. This article covers SPC technology keys such as documentation, training, reviewing, and process improvement.
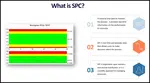
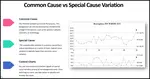
SPC definition
Here we discuss the SPC definition. We describe the charts and the meaning of "special cause variation". Read more...
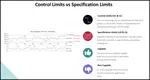
Control Chart SPC, Control Charts and limits
Learn about control chart SPC and the differences between process limits and specification. Article includes pictures of these limits with control charts.
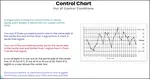
Control Charts
Control Charts, Variable data, Attribute data, Variation, Total Quality Management Tool
statistical process control
This article covers a roadmap for statistical process control. Discusses chart structure and implementation mistakes.
|
Quality Assurance Solutions Robert Broughton (805) 419-3344 USA |
 |


 |
Software, Videos, Manuals, On-Line Certifications | |
 |
450+ Editable Slides with support links | |
 |
Corrective Action Software | |
 |
Plan and Track Training | |
 |
AQL Inspection Software |
 |
Learn and Train TRIZ | |
 |
Editable Template | |
 |
Templates, Guides, QA Manual, Audit Checklists | |
 |
EMS Manual, Procedures, Forms, Examples, Audits, Videos | |
 |
On-Line Accredited Certifications Six Sigma, Risk Management, SCRUM | |
|
|
Software, Videos, Manuals, On-Line Certifications |