Regression
Regression is one of the statistical tools used in the six sigma approach. It lets you know if two variables are related to each other. It determines...
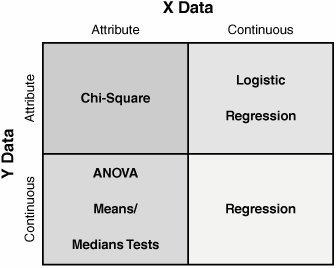
- The statistical significance of a relationship between a Continuous X and a Continuous Y in Y =f(X1,X2,..., Xn).
- The nature of the relationship itself (i.e., the actual equation).
Two Forms:
1) Simple linear, which relates one Continuous Y with one Continuous X
2) Multiple linear, which relates one Continuous Y with more than one Continuous X

This Data Analysis Video teaches you the basic tools for understanding, summarizing, and making future predictions with your collected data. Includes MS Excel templates.
For both the simple and multiple techniques, the model parameters are linear in nature, not quadratic or any other power. Given the sheer size of the subject and the application of the tool in Lean Sigma, this page focuses primarily on the simple linear method. For a deeper theoretical understanding, see Introduction to Linear Analysis by Douglas Montgomery and Elizabeth Peck.
Collecting And Analyzing
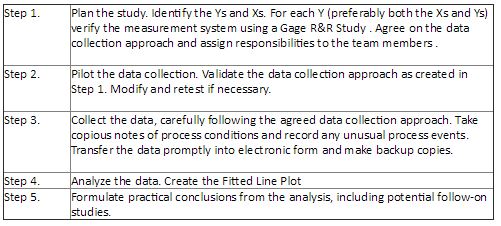
As with all statistical tests, a sample of reality is required. Generally we require 30 or more data points for the X and the corresponding value of. This is a passive analysis tool. Do not actively manipulated the process during the data capture. After collecting the requisite number of data you enter the data as two columns into a statistical software package and then analyze it.
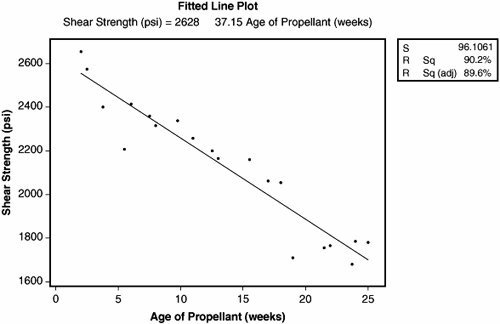
Example Fitted Line Plot
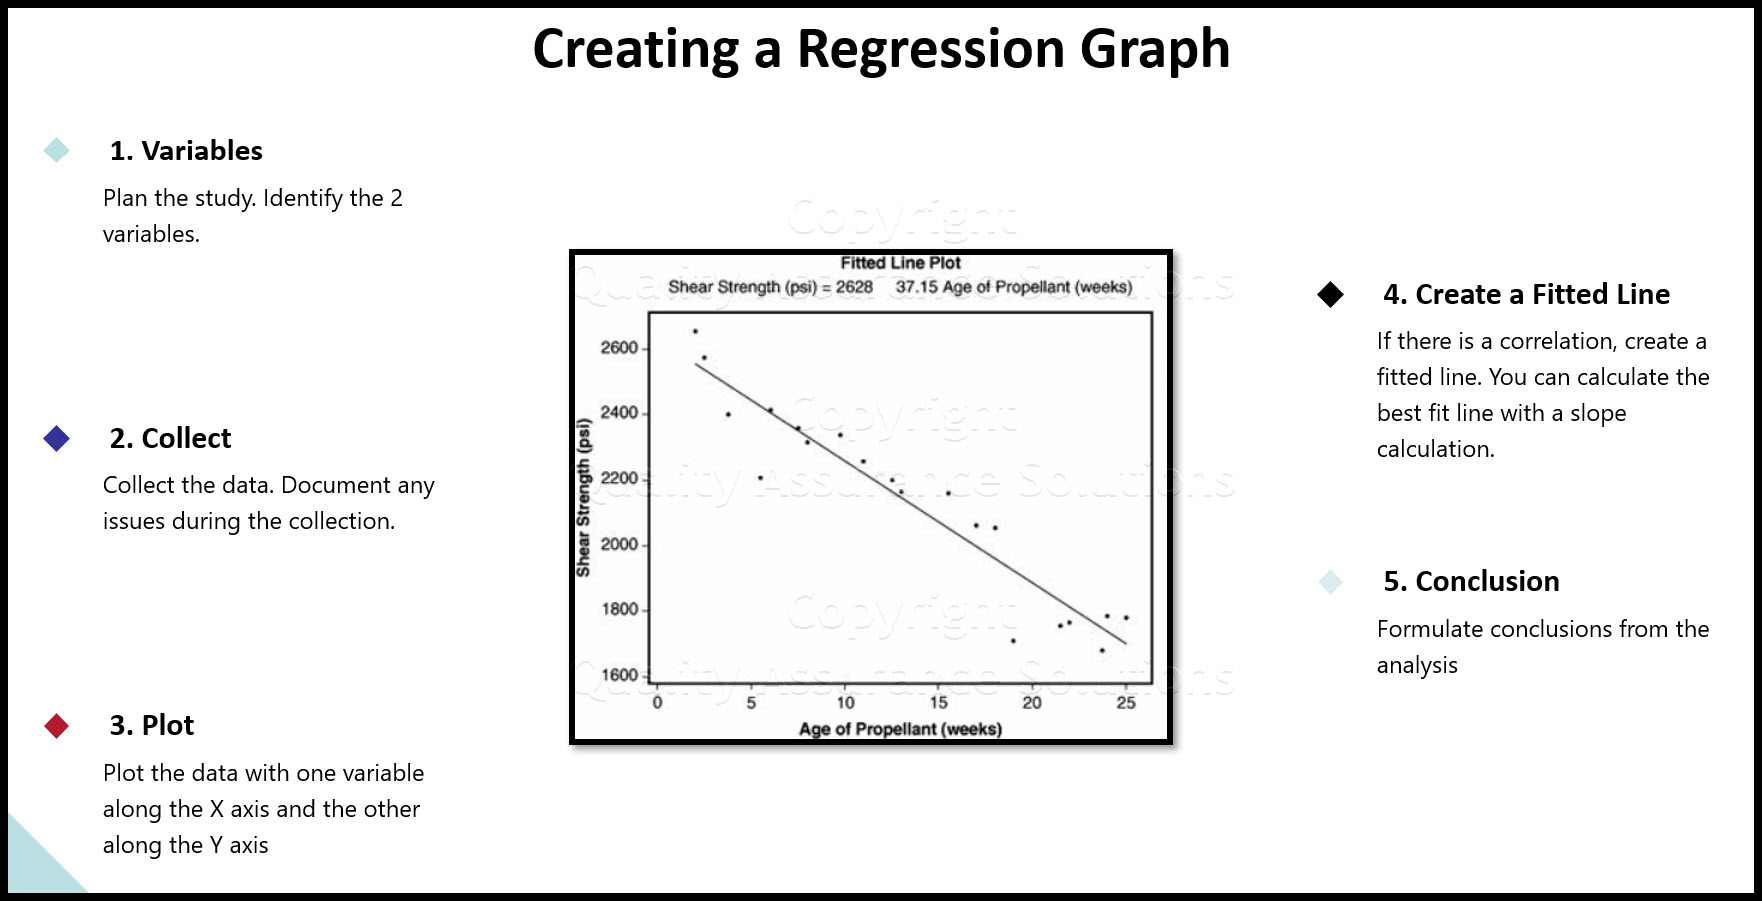
Analyzing the data graphically using a United Plot shows a result similar to the example shown below. Here the X is "Age Of Propellant" in a rocket motor and the Y is "Shear Strength" of the propellant at that age. The data points are plotted on a Scatter Plot. Then a straight line is fitted through them to give the best statistical fit. This is the regression line.
To draw the line we use the least squares method, which minimizes the total squares of all the distances from the line.
The equation of the regressive straight line (the Regression model) is
Shear Strength (psi) = 2628 37.15 x Age of Propellant (weeks)
Thus, in the future, for any Age of Propellant from 0 to 25 weeks, it is possible to predict the physical property of Shear Strength. Also, if you need to maintain the Shear Strength above a minimum to perform correctly, then you can calculate a would-be shelf life for the propellant based on the model.
There is no data outside of this time frame and so no predictions should be made beyond 25 weeks.

Learn SPC in an hour. Train your employees. Improve your processes and products. Prevent defects and save your company money.
Roadmap
Problems With Regression
In its simple linear form is quite straight forward to apply. There are, however, as with all tools, several pitfalls that could cause you problems.
This statistic creates a prediction model for behavior of the response Y based on the predictor X. However, if the X itself cannot be predicted, then the model is useless. An example of this might be the desire to predict a electrical power generation maximum daily load from a maximum daily temperature model. But the accuracy of predicting maximum temperature is patchy at best.
Regression is an interpolation technique, not an extrapolation technique. Predictions from regression models are made only with confidence within the confines of the data. If no data has been taken in an operating region, the model is hit and miss at best. To remedy this, take data points over the breadth of the prediction region.
Single points can heavily affect the models. In graph A of the below figure the single outlier dramatically reduces the slope of the model. If the outlier is a bad value, remove the value because the model estimates are wrong and the error is inflated. However, if the outlier is a real process value, it should not be removed. It is a useful piece of data for the process. Refer to notes taken during data collection to understand the point and if possible try to recreate it.
This Data Analysis Video teaches you the basic tools for understanding, summarizing, and making future predictions with your collected data. Includes MS Excel templates.
The Effect Of A Single Data Point On The Regression Model
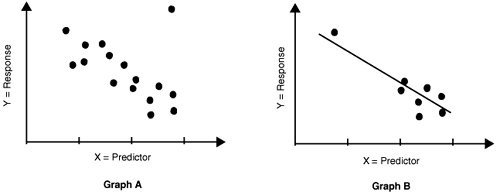
In Graph B the single outlier increases the coefficient. In this case, evaluate the model with and without the point to determine its effect. If the slope value greatly changes during this analysis, then that value is too influential. Conduct other data runs near that point to lower its leverage and confirm its' validity.
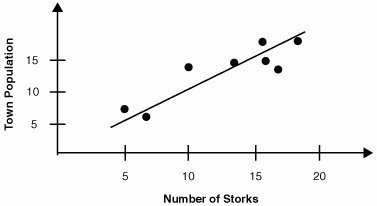
Regression models should represent meaningful relationships. Take for example the relationship shown in below figure. Population data within a city correlates with the population density of storks. As much as I'd like to believe this relationship, it could equally be the reverse, mundane scenario. As the town's population increases then there are more chimneys (nesting grounds for storks); thus the stork population increases accordingly.
Incorrect Causal Relationships
Source SBTI's Lean Sigma Methodology training material
More Info
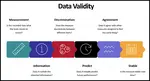
Data and Information
Data and Information, are often used interchangeably, they don’t mean the same thing
Process Improvement and KPOVs
Lean Sigma is different to many traditional Process Improvement initiatives in its reliance on data to make decisions
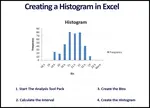
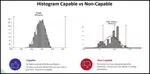
Histogram in Excel
Follow these steps to create a Histogram in Excel. This includes turning on data analysis, creating bins, and sorting data.
Histogram Examples: A Picture of Your Data
See our histogram examples. We discuss normal distribution and how it applies to quality assurance. Histograms are a key process improvement tool.
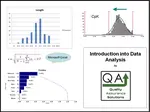
Learn Data Analysis Techniques
When you understand data analysis techniques, you take a big step towards making product and process improvements.


Data Analysis Video
Download Today. Don’t take chances without understanding your data. Data drives business decisions. But how does this work? This introduction to Data Analysis Video shows you how to gather, summarize, and present data to management and your team. $69.00. Satisfaction guaranteed.
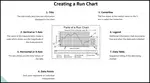
Run Chart
A Run Chart displays the process performance over time. It is a line graph of data points plotted in chronological order. Learn more!
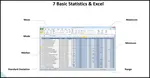
Data analysis in excel
Data analysis in excel discusses calculating averages, ranges, and standard deviation in Microsoft Excel.
Continuous Data
Learn how to evaluate your continuous data and assure satisfactory inspection. Without conducting an MSA on your data set, you put your inspection data at risk.
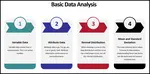
What is Data Analysis? A Tool for Continuous Improvement
What is data analysis? Understanding data is key to continuous improvement, your quality assurance systems and ISO 9001 certification.
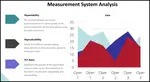
Validity for Measurement Systems
Understand Measurement System Analysis, and we present a road map to apply MSA Validity
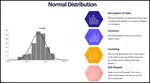
Statistics Normal Distribution Described
Do you know the statistics normal distribution? Normal distrubution is critical to know for your quality assurance program.
Understand Process Capability
Learn about Process Capability, Process Drift, PpK Vs CpK
MSA Attribute data
An overview of MSA Attribute data and how MSA data affects your processes

Process Capability Studies
Process capability studies demonstrate the fit of your data to your specifications. Machine process capability determines current and future defects.
Chi Square
Learn how to apply Chi Square in practice, when to use it , how to insure results


- QAS Home
- Data Analysis
- Regression


 |
Software, Videos, Manuals, On-Line Certifications | |
 |
450+ Editable Slides with support links | |
 |
Corrective Action Software | |
 |
Plan and Track Training | |
 |
AQL Inspection Software | |
 |
Learn and Train TRIZ |