Overall Equipment Effectiveness
( OEE )

Overview
In lean six sigma, one uses Overall Equipment Effectiveness ( OEE ) in equipment maintenance to determine equipment reliability and equipment availability. If you have a maintenance background and are familiar with Overall Equipment Effectiveness, do not skip this overview. For lean six sigma, there are some key differences to consider.
Lean Sigma extensively uses the notion of entitlement, which means perfection of the process. The goal for any process is 100% yield and zero defect rate. The goal for machine capacity is 100% use. Capacity is a slightly trickier metric to apply entitlement to, but Overall Equipment Effectiveness helps us measure this.
OEE represents the percentage of process capacity entitlement:
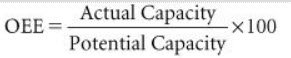
In simple terms, a process achieves 100% overall equipment effectiveness when it is up (running) doing only value added work 100% of the time, running at its fastest speed, and producing 100% perfect quality. Based on this OEE is broken into three elements,
OEE = %Uptime x %Pace x %Quality
The major difference from the maintenance version of Overall Equipment Effectiveness is addition of %Uptime.
In maintenance terms, %Uptime measures the percentage of available process time to do work. This includes non value add work. But in Lean Sigma, %Uptime measures the percentage of time that the process is doing only value add work, which typically is significantly less than maintenance %Uptime.
PDCA Complete is an organizational task management system with built-in continuous improvement tools. Includes projects, meetings, audits and more.
Built by Quality Assurance Solutions.
Logistics
Although one person could measure Overall Equipment Effectiveness, in practice it takes a team to gather the data correctly calculate the results.
The team typically captures the data for a minimum of 24 weeks to be meaningful. The time period depends on the drumbeat of the process and the frequency of things, such as changeovers and maintenance time. For some large equipment processes, data for a whole year might be more relevant.
During the data collection time the team concurrently records three measurement points, one for %Uptime, one for %Pace, and one for %Quality.
Process operators must participate in the data capture, so planning and communication are key. Create a clear operational definition of the metric to explain the measurement.
After completing the initial analysis complete, continue capturing this measurement on an ongoing basis.
%Pace measures the process speed. %Quality measures the process yield. %Uptime measure available process time. See below for details.
1- % Uptime
This is not opposite of "downtime". Downtime occurs with a broken process. In reality, the process is "down" at many other times. The formula for %Uptime...
Lean six sigma defines uptime as the time the process (or process step) conducts value added (VA) work. Consider all other activities as downtown. This includes...
- Setup
- Changeover
- Loading
- Unloading
- Idling empty
- Idling full
- Breaks for lunch, and so on
- Cleaning
- Maintenance (planned or otherwise)
- Breakdown
- Scheduled downtime
- Off-shift hours (see Variants)

8D Manager Software with 8D, 9D, 5Y and 4M report generator. Your corrective action software for managing, measuring, and reporting issues.
Utilize this metric to look for opportunity, but not as a typical operations metric to judge supervisor or employee performance.
%Uptime brings a whole new perspective to a process. You may find processes that were previously seen as nearing 100% utilization are now less than 50% utilized.
To best collect the data, put each activity's time into predetermined buckets representing the above possible classifications. Normally you manually collect the data with the operator recording times on a activity table throughout the day. Clearly explained the purpose to the operators. This prevents them from "massaging" the data because it's not in their interest to do so.
After gathering the data analyse it in a simple Pareto Chart or Pie Chart
Variants of Measurements
The time parameter %Uptime is 24 hours, 7 days a week. This often represents the simplest capacity expansion option, But most processes don't work 24 hours a day, 7 days a week. From the point of view of the OEE metric, you usually deal with this issue by introducing these additional metrics:
- Overall Equipment Effectiveness for the current shift
- Overall Equipment Effectiveness for 24 hours and weekdays only
- OEE for 8 hours and 5 days a week
- Obviously one can use many possible variants depending on the current business situation.

Get certified in Risk Management through our completely on-line training system. Study at your own pace.
2- % Pace
Often confuse with %Uptime and %Quality, this is usually the trickiest of the three Overall Equipment Effectiveness sub-metrics to measure. Max pace cannot be achieved because sometimes processes slow down but entities still flow through the process. The reduce flow rate maybe due to resource or material constraints, or to ensure good product is being made (hence the confusion with %Quality).
To calculate %Pace, you must determine the Peak Rate of the process in units per unit time. Calculate this on a short duration (usually 14 hours of processing). After finding the peak rate, you label this d as the entitlement rate.
Now determine the typical processing rate. Calculate this by determining the average number of entities processed during the actual working time of the process. Collect this data over the period of a week or two. Keep the measuring unit the same as peak rate.
Variants
Another entirely equivalent method of determining the %Pace is to judge the process by the time it takes to process a single unit. To calculate this you need to know the ideal cycle time. Calculate cycle time as the time between units exiting the process. Ideal cycle time is the time when there is literally no constraints, such as resources. Ideal cycle time equates to the instantaneous Peak Rate expressed in time (the fastest the rate, the shorter the time).
After the calculating the ideal cycle time, simply determine the average cycle time by capturing actual data during the uptime of the process. %Pace is the ratio of the two numbers:
or simply:

Improve your company's on time delivery with this proven system.
3- % Quality
The quality rate is probably the simplest of the three sub-metrics. See the below equation:
In simple terms, it is the percentage of correctly produced units in a given time. Quality groups collect this data as a matter of course and a months worth of data more than suffices for the %Quality metric.
Capacity Loss Classification
The table below helps with the most common capacity loss categorizations.
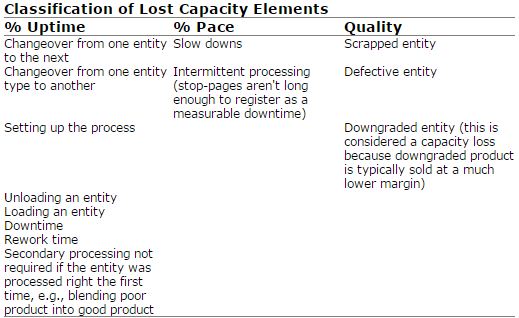
For some processes, the %Pace and %Quality are linked and the quality degrades as the pace is increased. In these cases, make a composite metric of Pace and Quality such as weight of good product per hour. You still deal with uptime separately. The new OEE equation is
OEE = %Uptime x %(Rate of Quality Product)
Identify instantaneous best rate of quality product from historical data, or calculated from basic scientific principles (mass continuity, and so on).
TrainingKeeper Software. Keep, organize and plan all your employees' training and activities. Software includes multi-user support with reports, certs, and calendars.
Interpreting the Output
OEE yields two incredibly valuable pieces of information:
1) The possible capacity from the process
2) The best place to look to improve the process (Uptime, Pace, or Quality)
This information guides the next steps in the project. If the OEE is running greater than 90%, then the process really doesn't have much opportunity to get better, any change would be tricky to find.
But typically OEE value for a production line is around 5% to 10%. If the OEE is less than 50% then there is ample opportunity to apply a project to the process and capture additional capacity. This assumes that there are additional sales for the capacity, because without it, the whole exercise is pretty much a waste of time.
The tool guides the team to the best place to capture additional capacity. Focus your projects on the easiest path. Unless one category obvious shows a shortfall, look to all three categories for improvement. It is easier to find a percentage here and there, rather than to find it all in the same place.
Other OEE
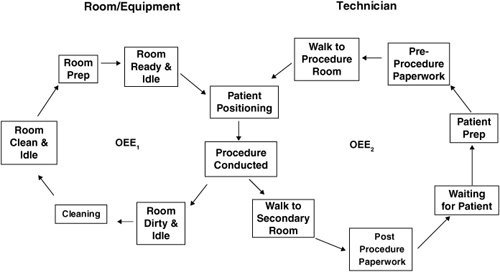
Overall Equipment Effectiveness can be applied to people. Deal with people carefully, as not many employees like to be examine for their percentage of VA activity. But this can be useful if that person is a constrained resource (such as lack of technical expertise).
An example of this is shown in Figure below where a diagnostic technician conducts procedures in a room with specialized equipment.
Because the combined resources room, equipment, and technician are required to conduct a procedure, an OEE for the room and equipment is required as well as for the Technician.
More Info
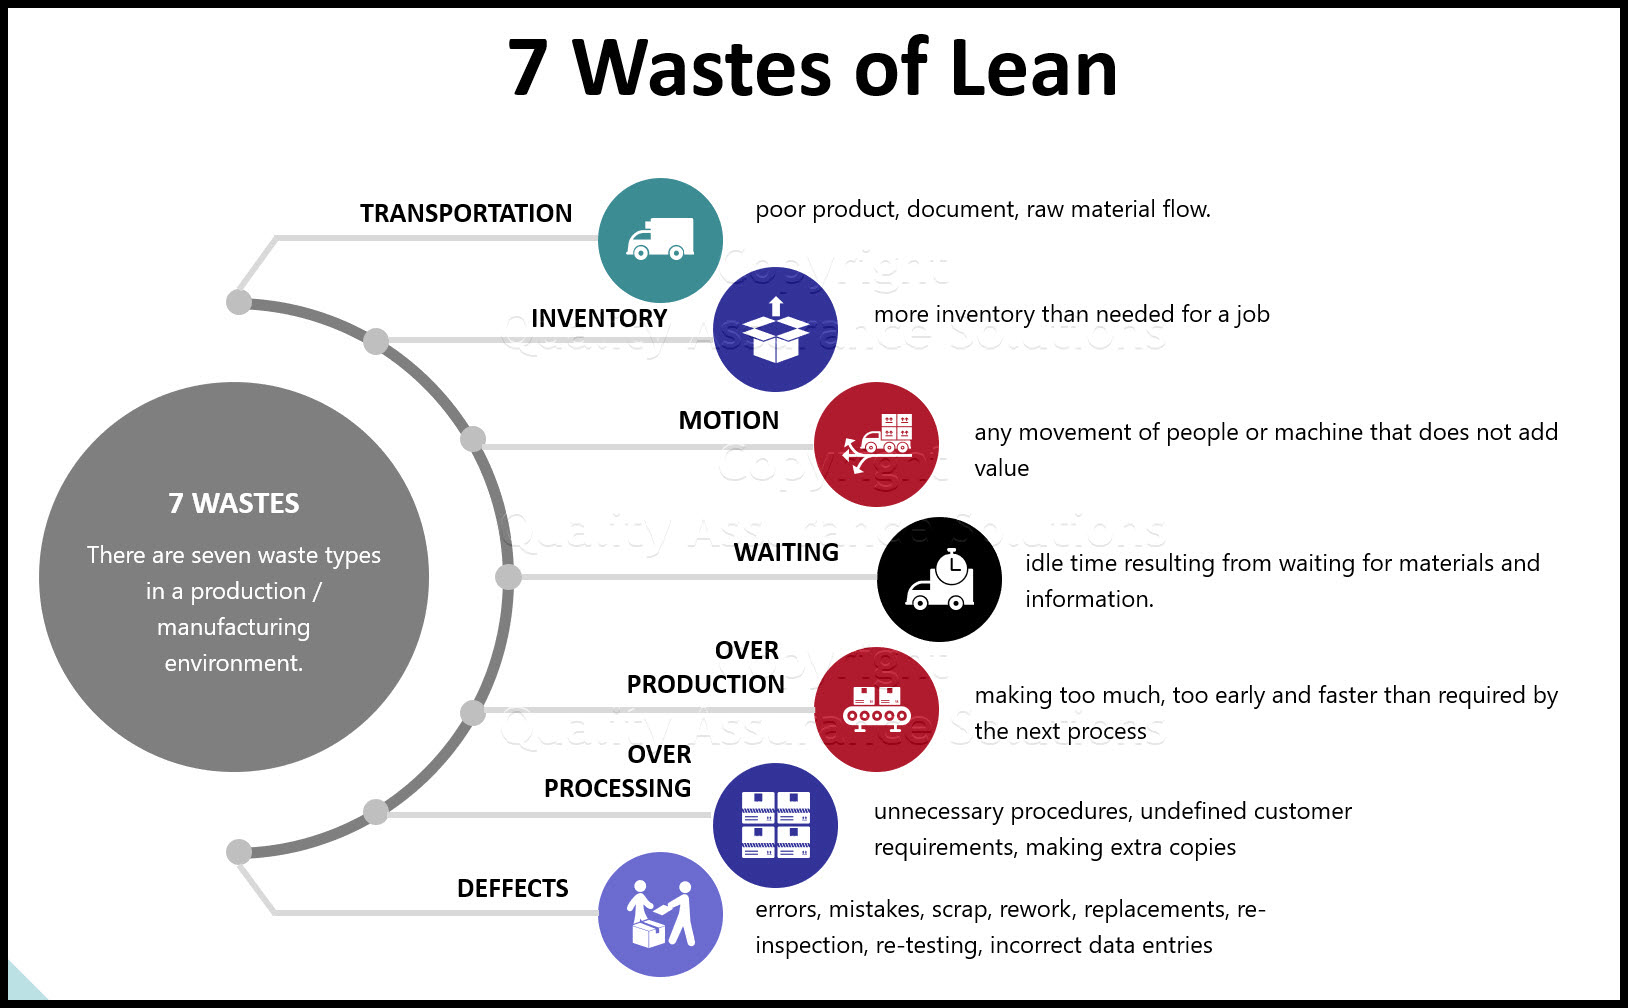
7 Wastes of Lean
Learn the 7 Wastes of Lean with this article.
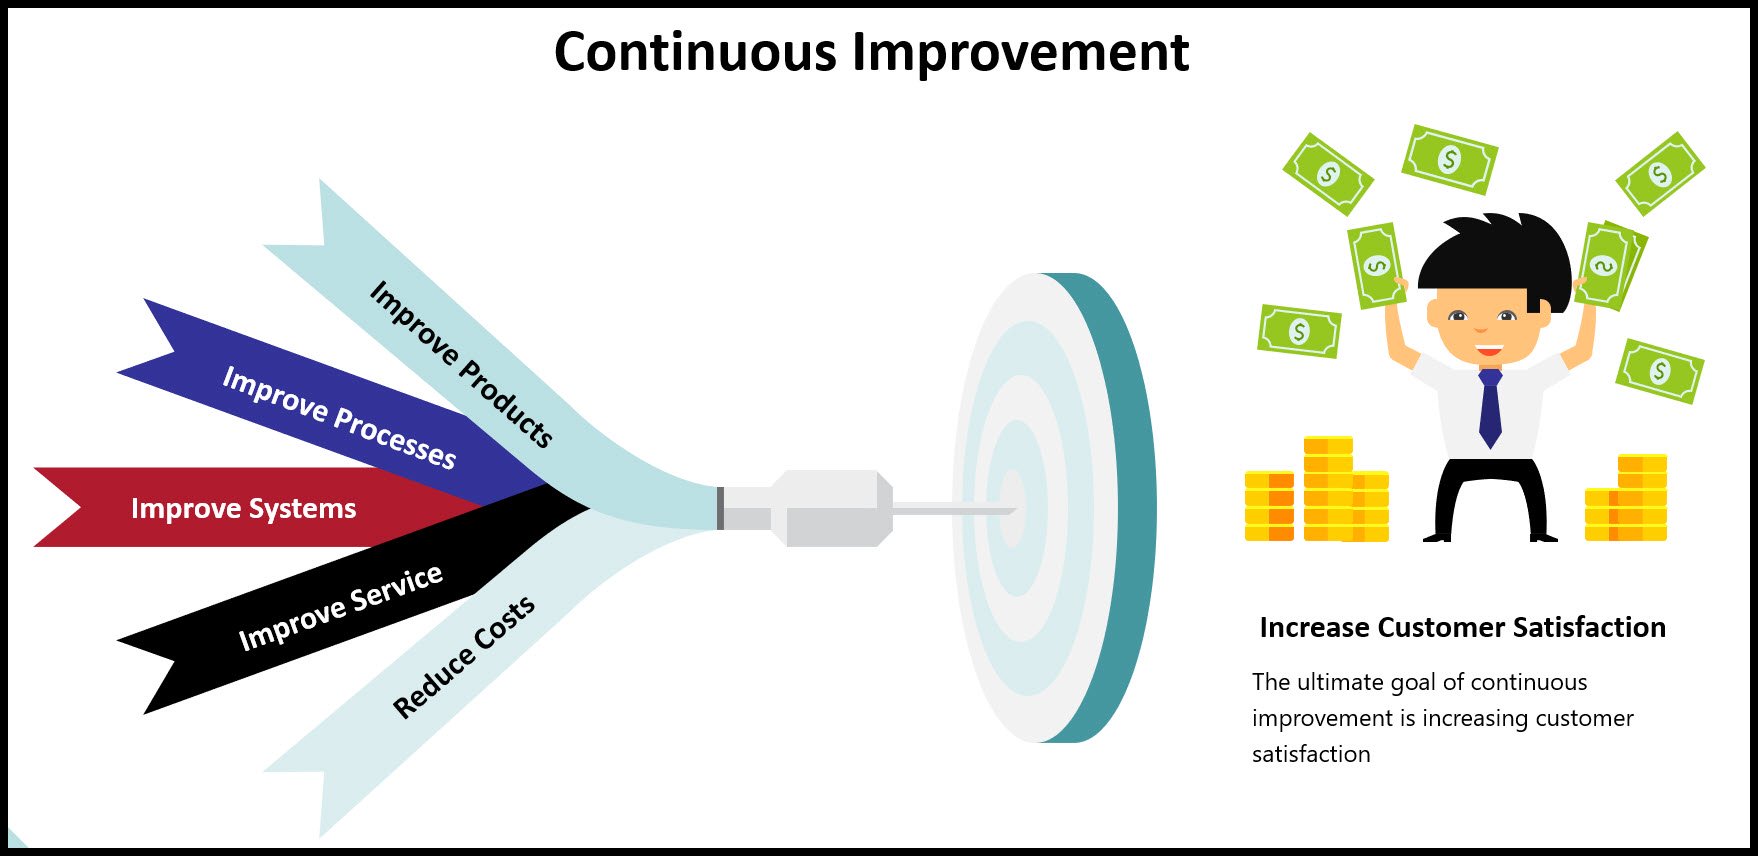
What is Continuous Improvement?
We answer the question, "What is continuous improvement". Quality Assurance Solutions provides the continuous improvement tools.
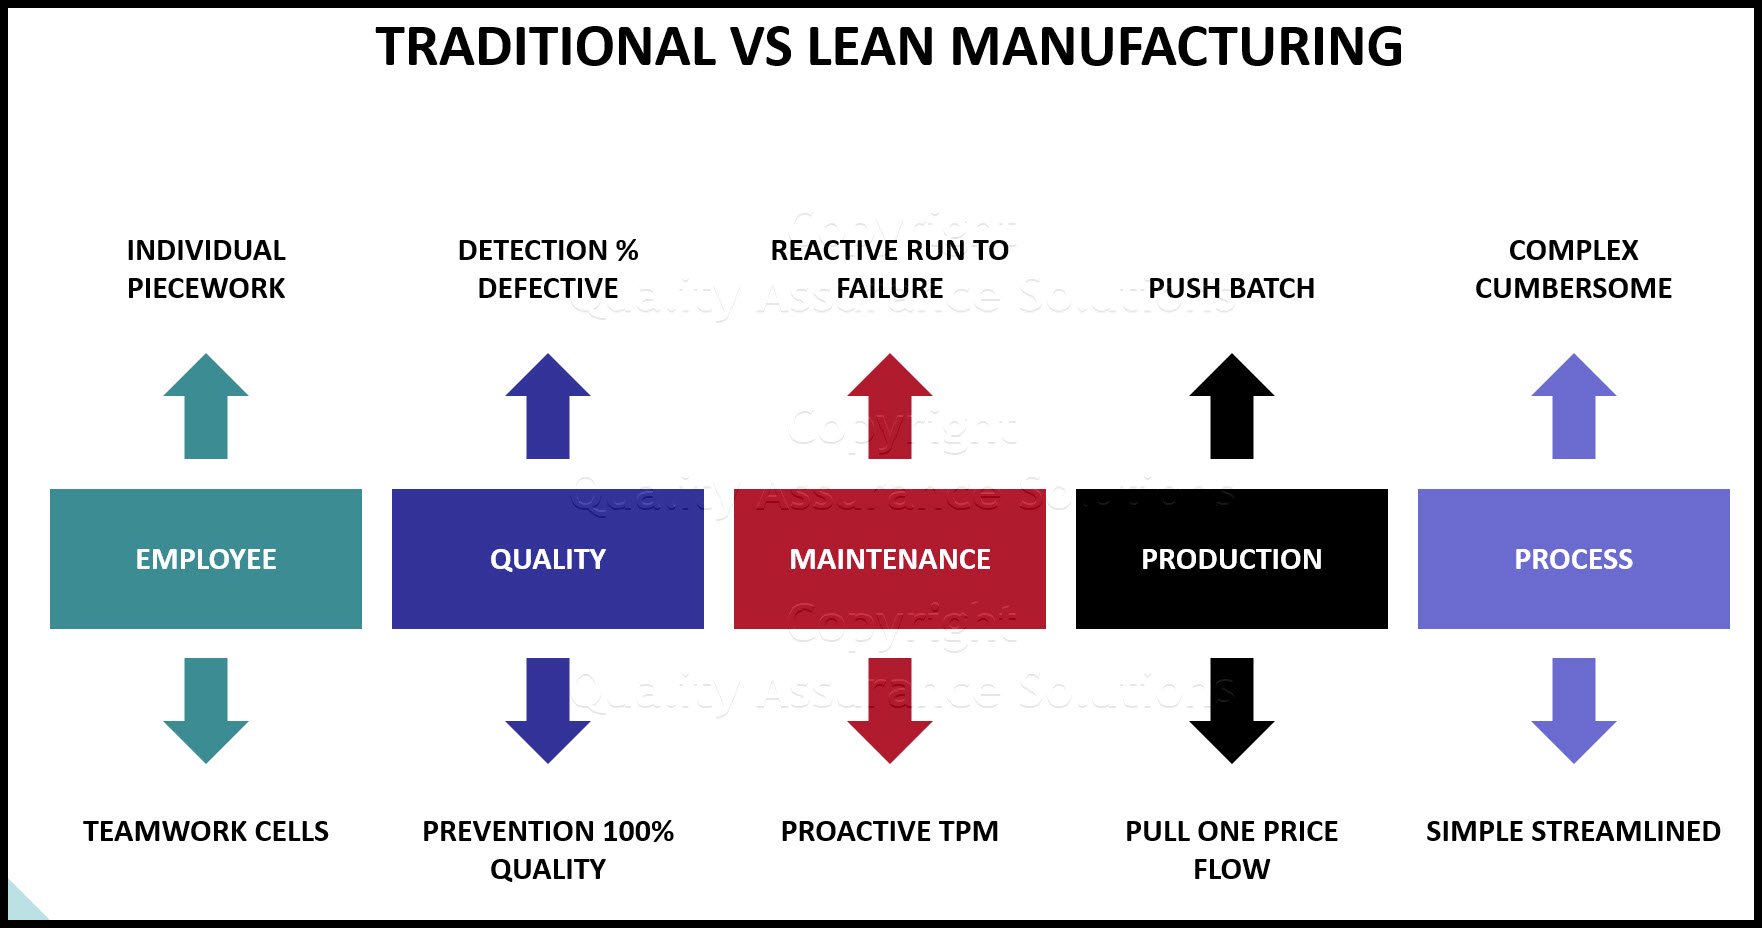
Lean Manufacturing
Lean manufacturing is a generic process management philosophy derived mostly from the Toyota Production System (TPS)
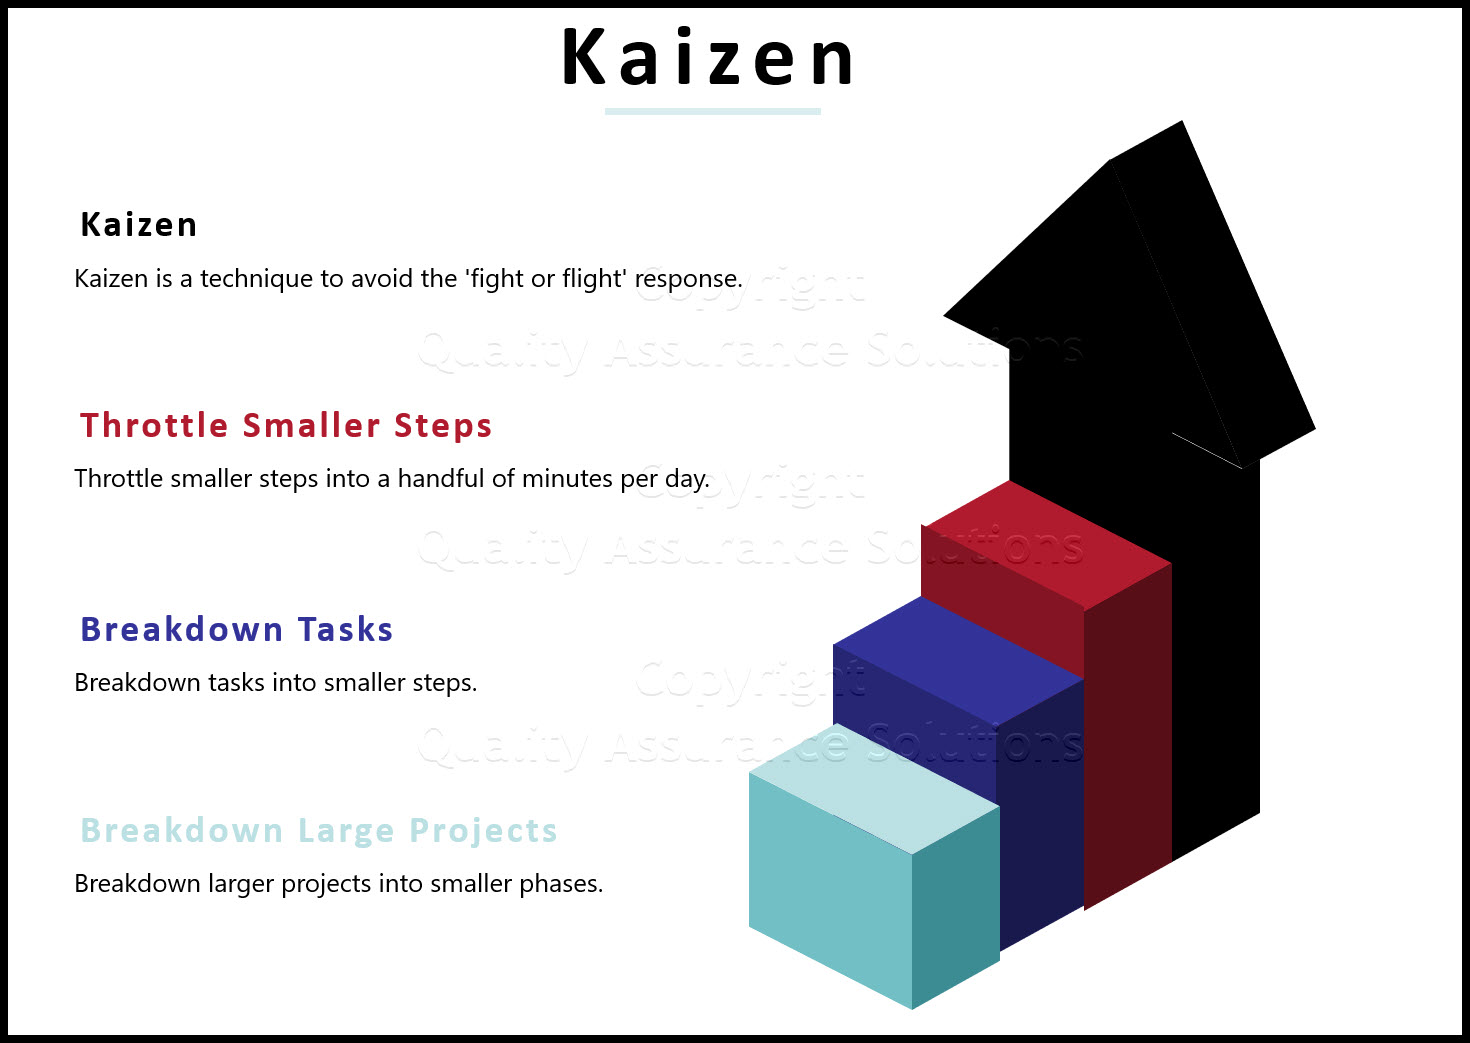
Here we Define Kaizen Events, Blitzes, and the 5S Concept.
We define Kaizen as an important continuous improvement tool for your business. Understand the Kaizen 5S concept of small improvement changes.
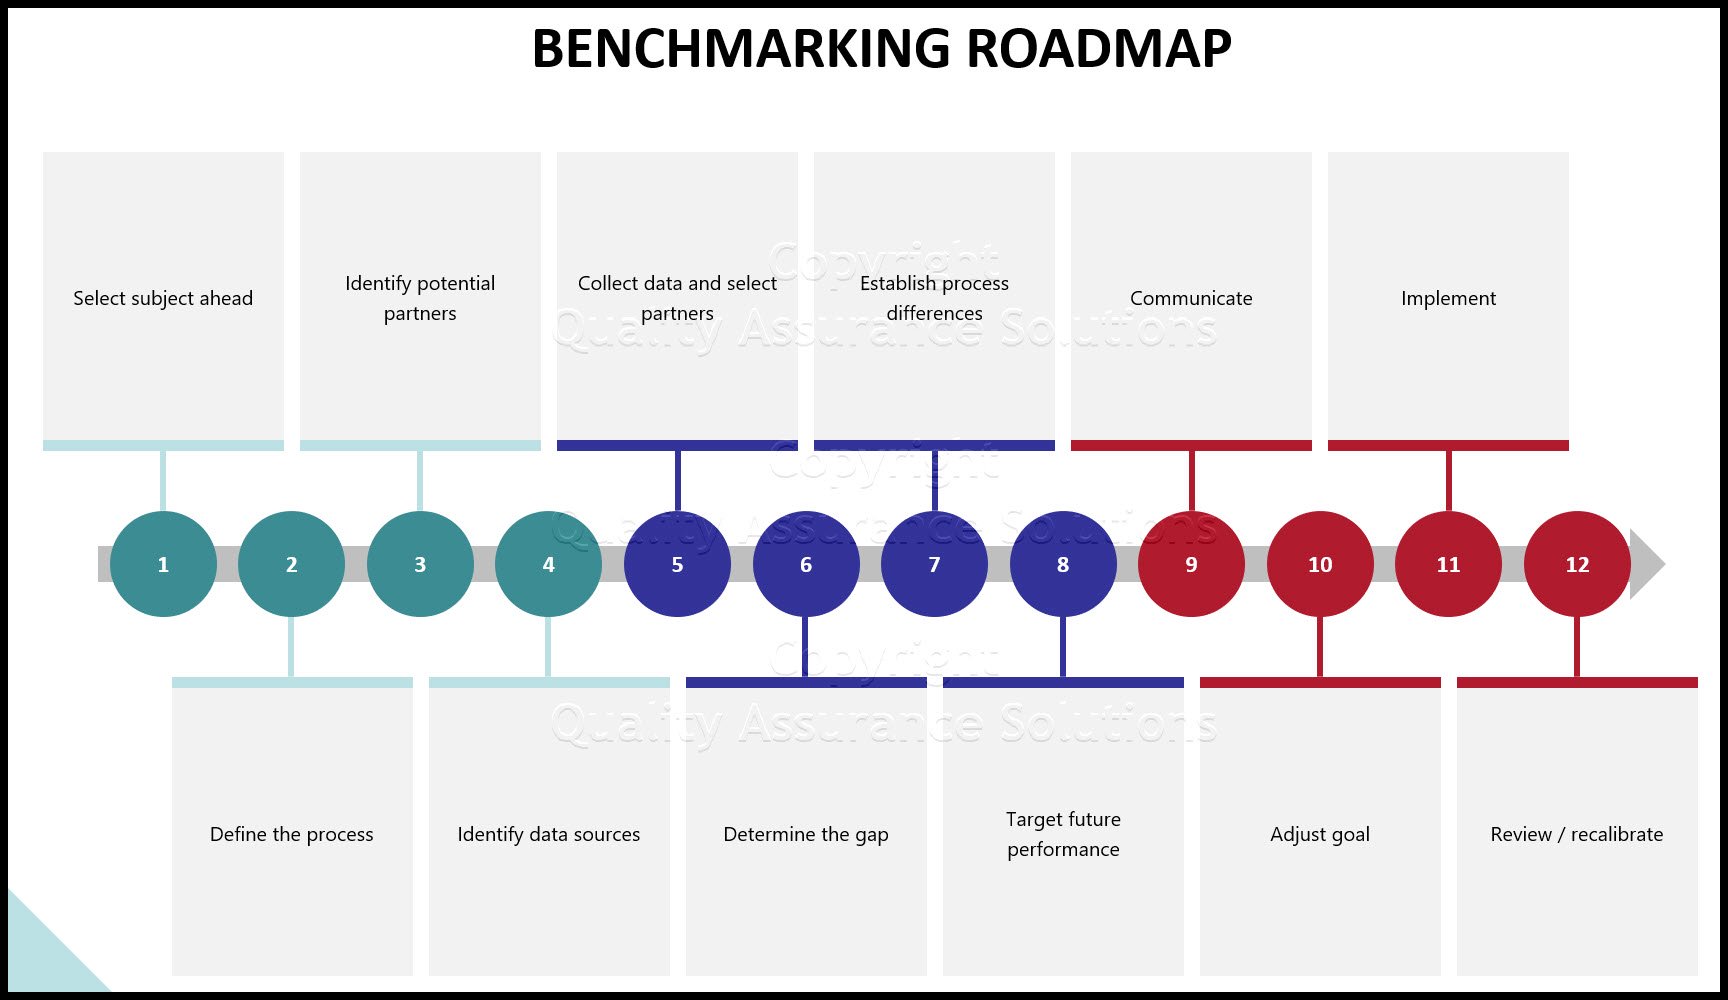
Benchmarking Definition and Benchmarking Best Practices
Our Article on benchmarking definition, benchmarking best practices, advantages of benchmarking and benchmarking steps. What is benchmarking?
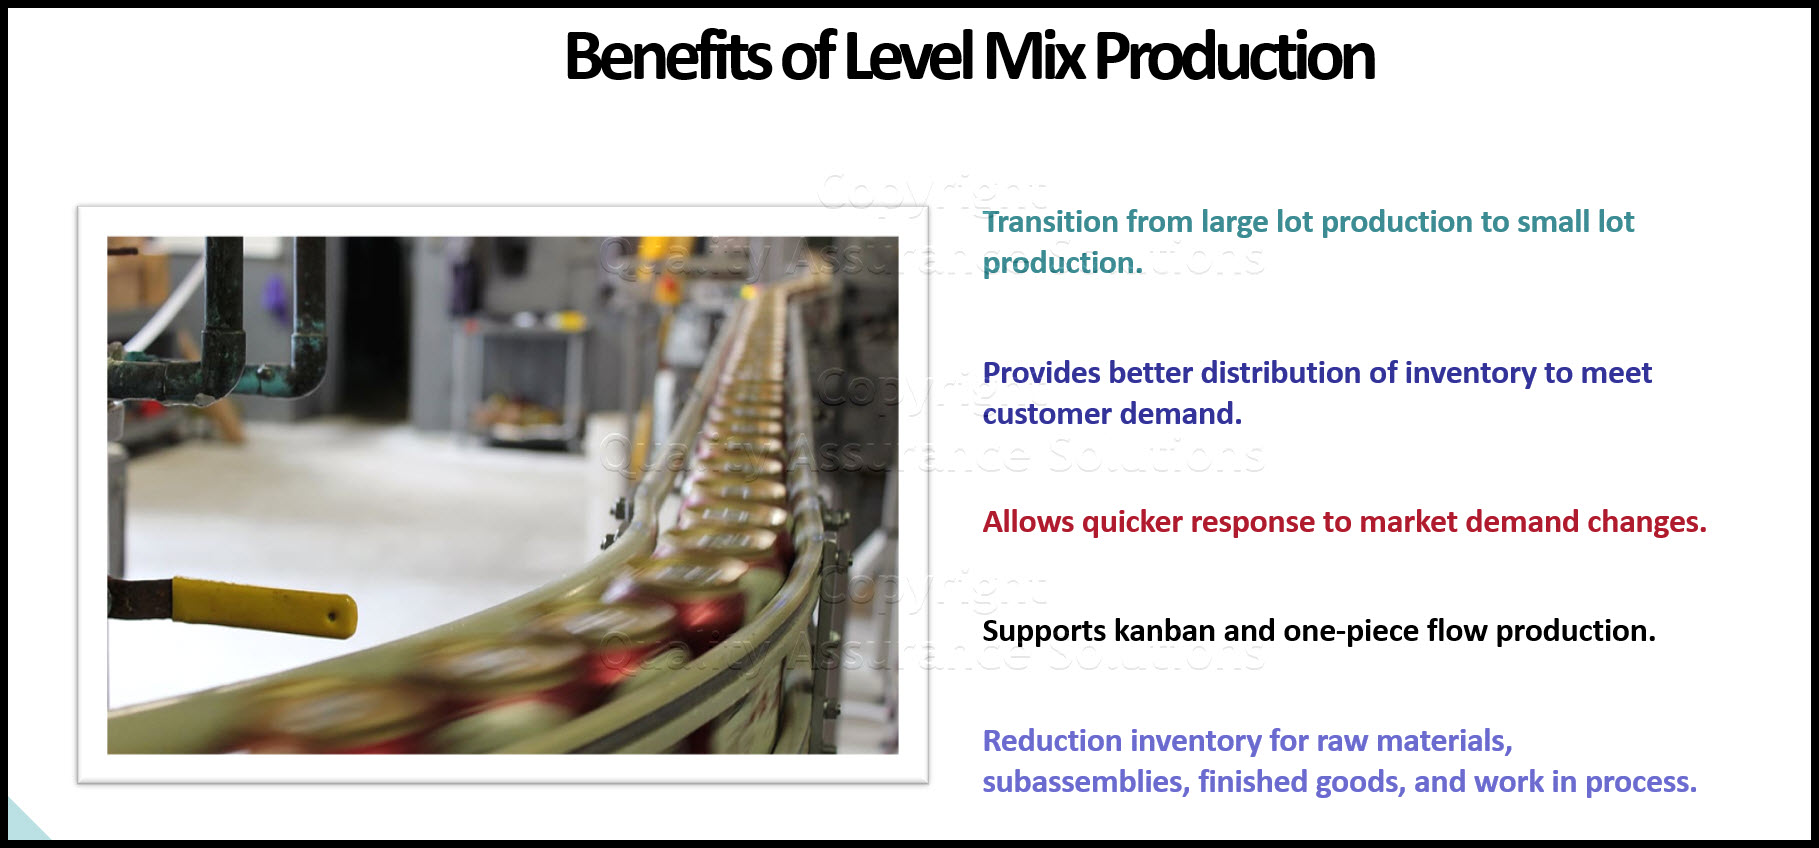
Level Mix Model Production
Level Mix Model Production means scheduling daily production in a sequence that evens out the peaks and valleys of produced quantities. Learn more!
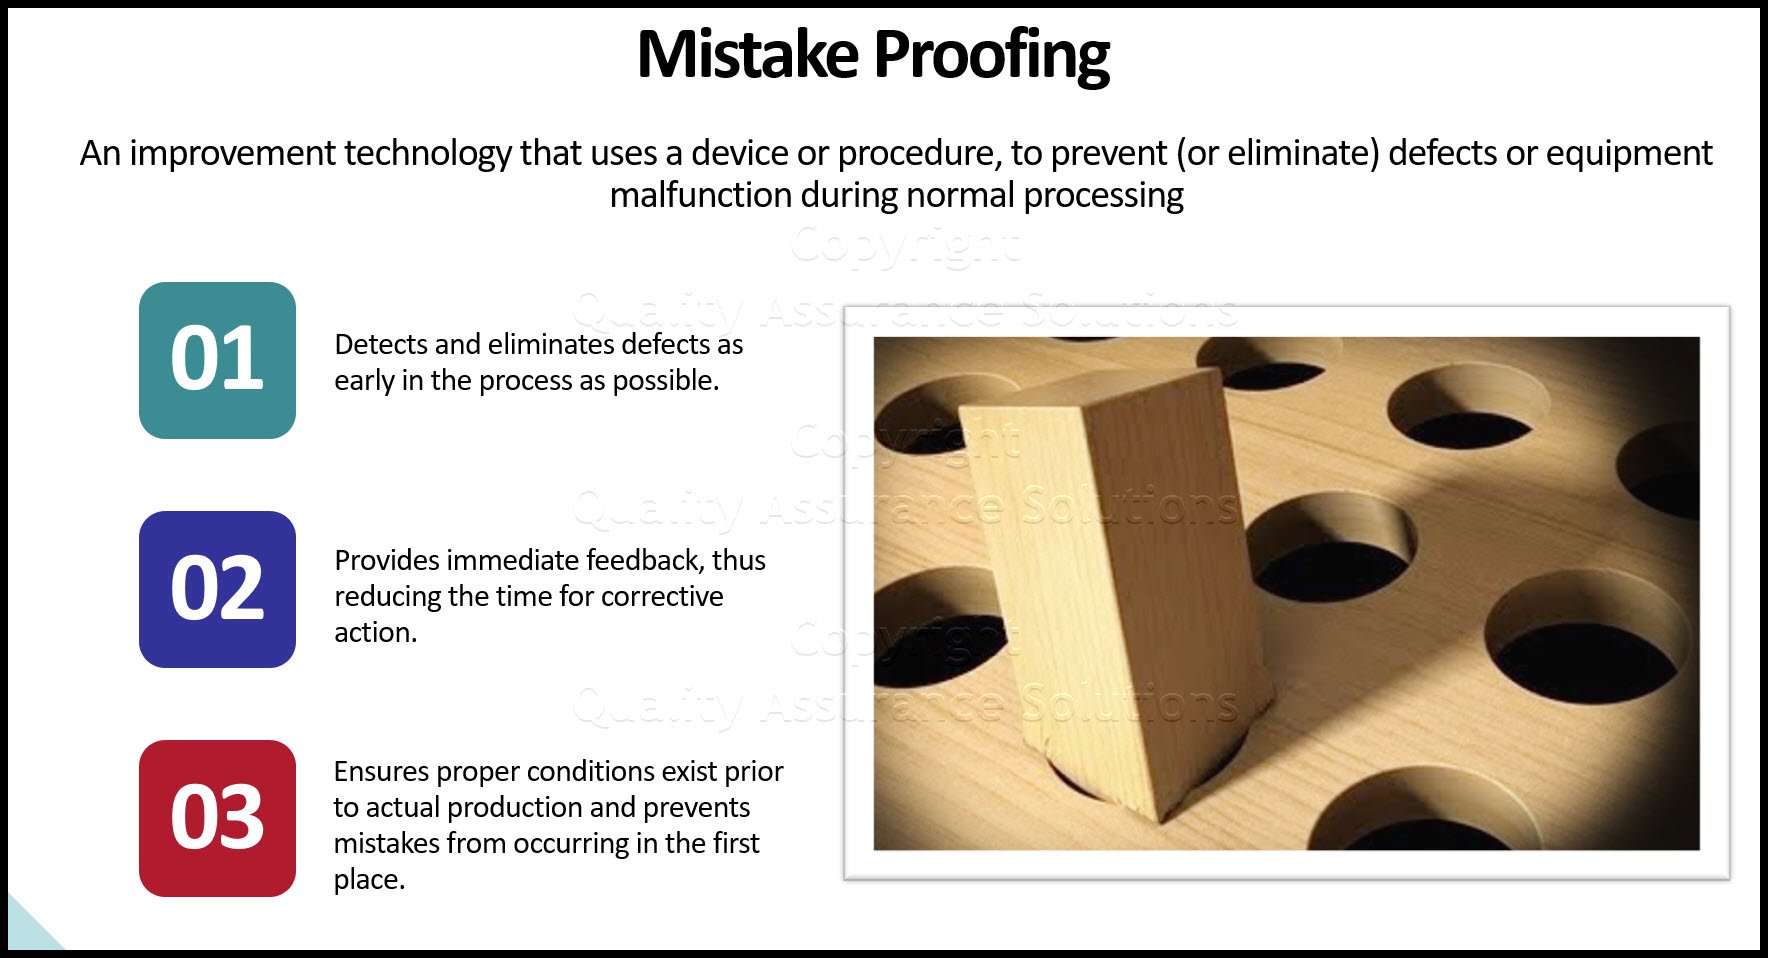
Mistake proofing
Mistake proofing is defined as an improvement technology that uses a device or procedure
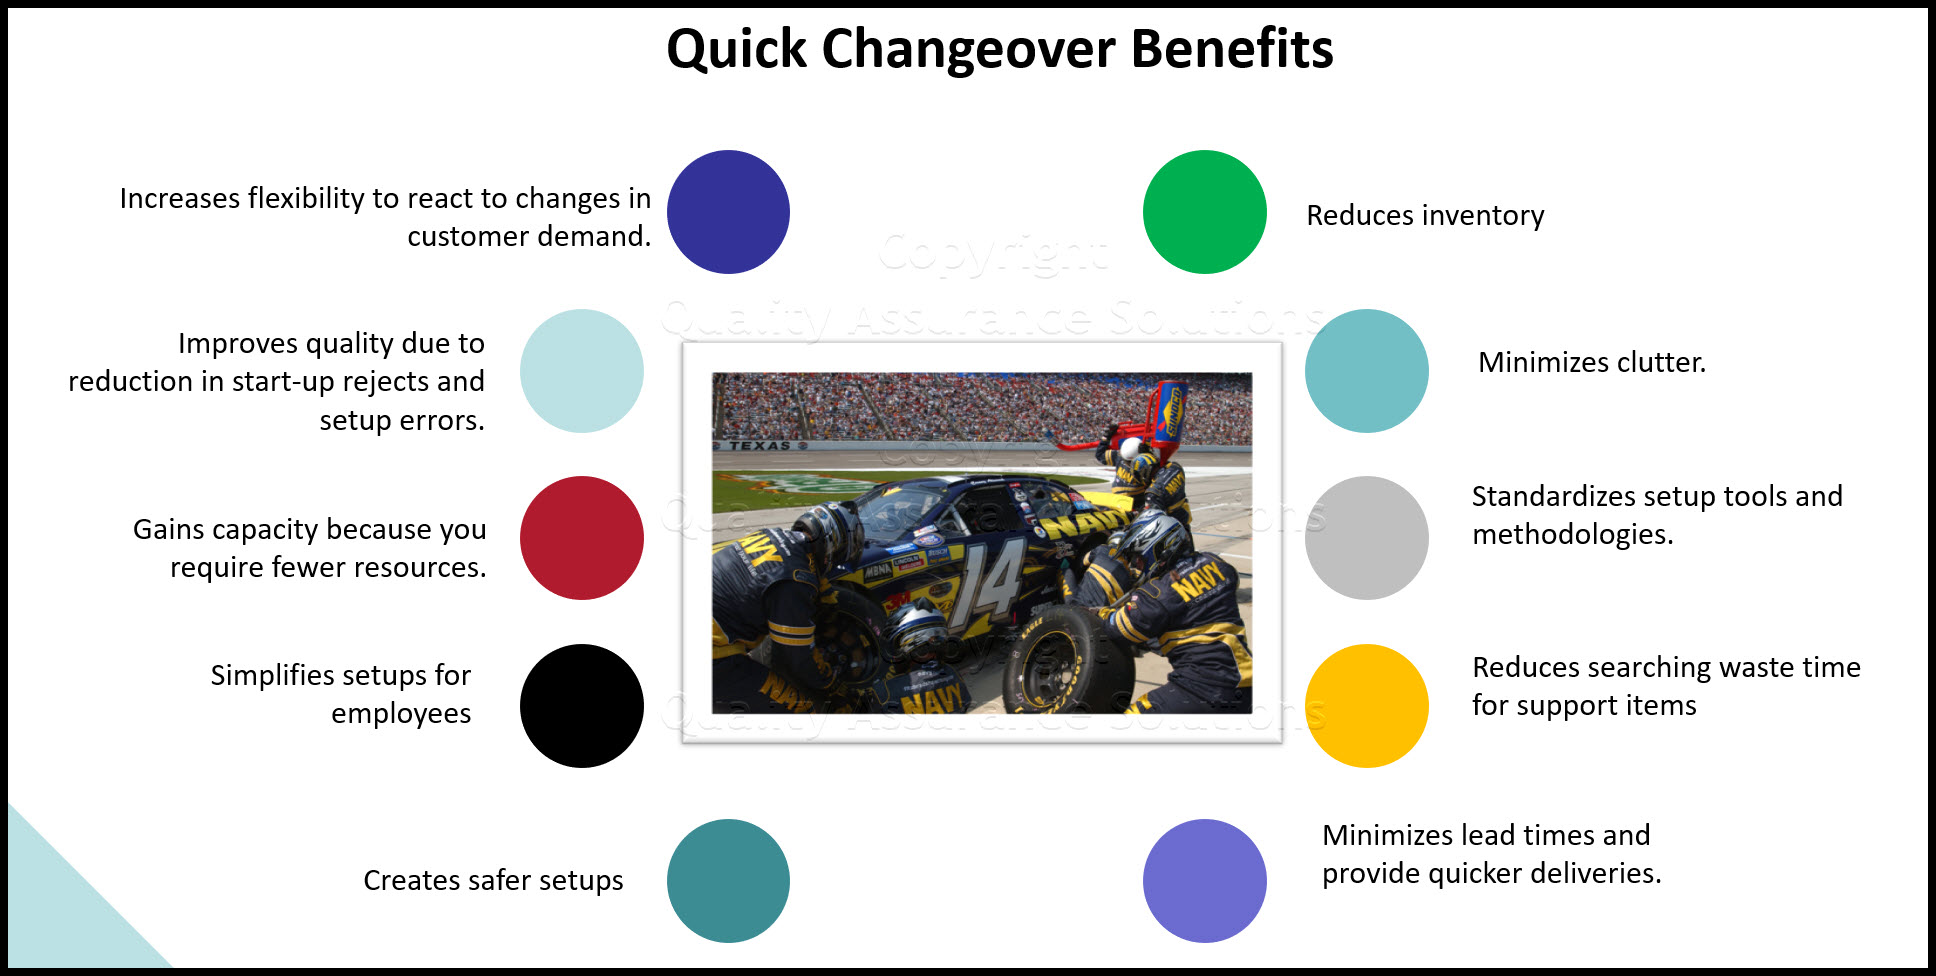
Quick Changeover
a NARROW view of Quick changeover as only the time required to pull an existing tool or fixture and set the new tool or fixture. but there is much more to it.
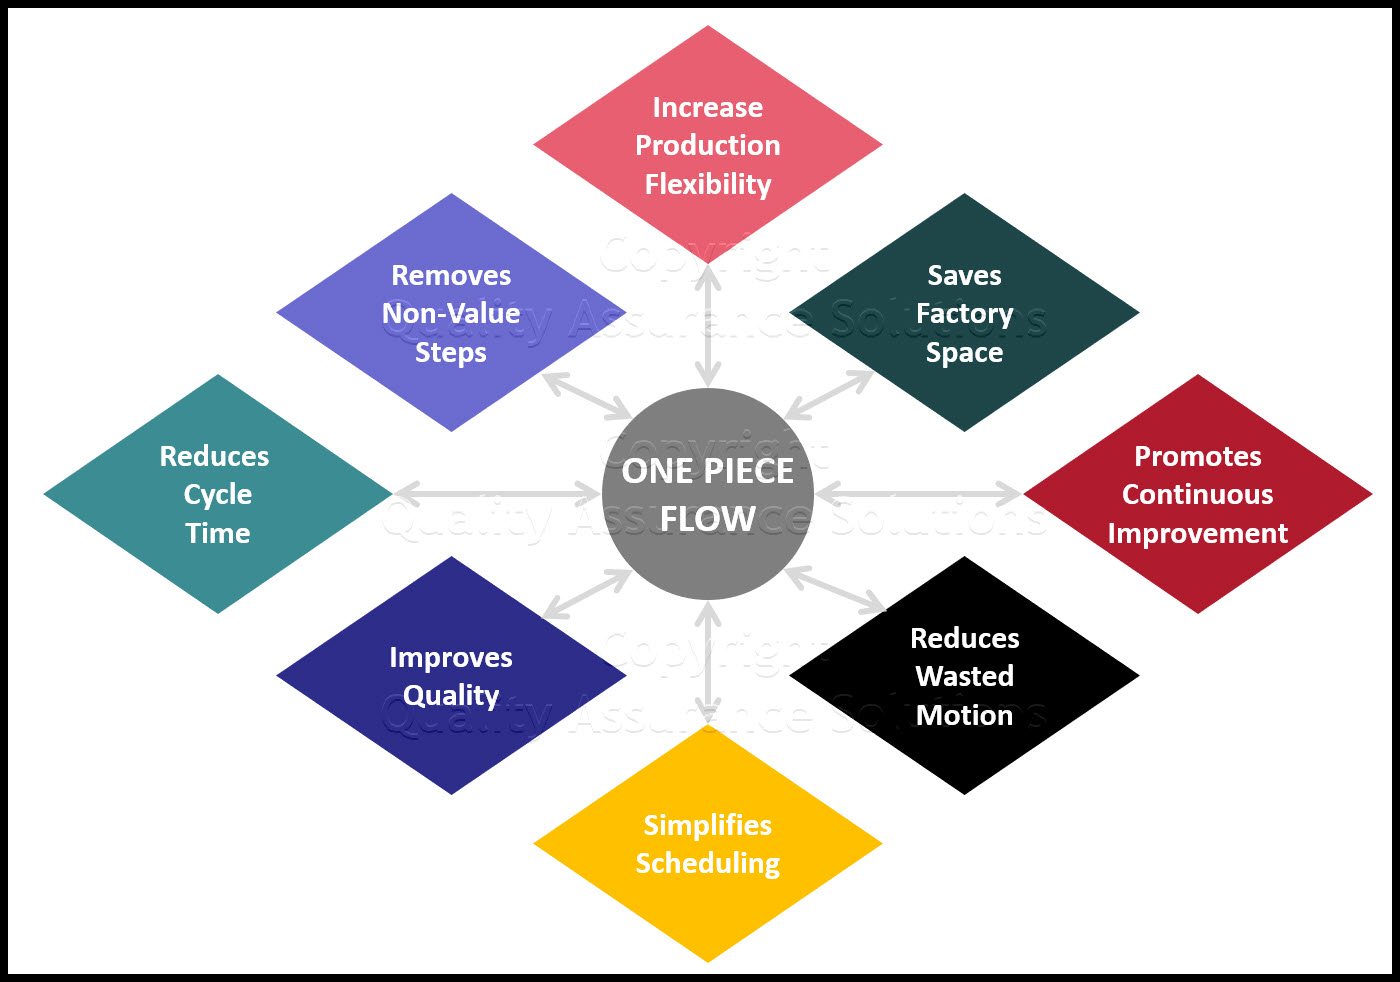
One Piece Flow
This article discusses all the benefits to one piece flow. Work cells help your manufacturing process with this.
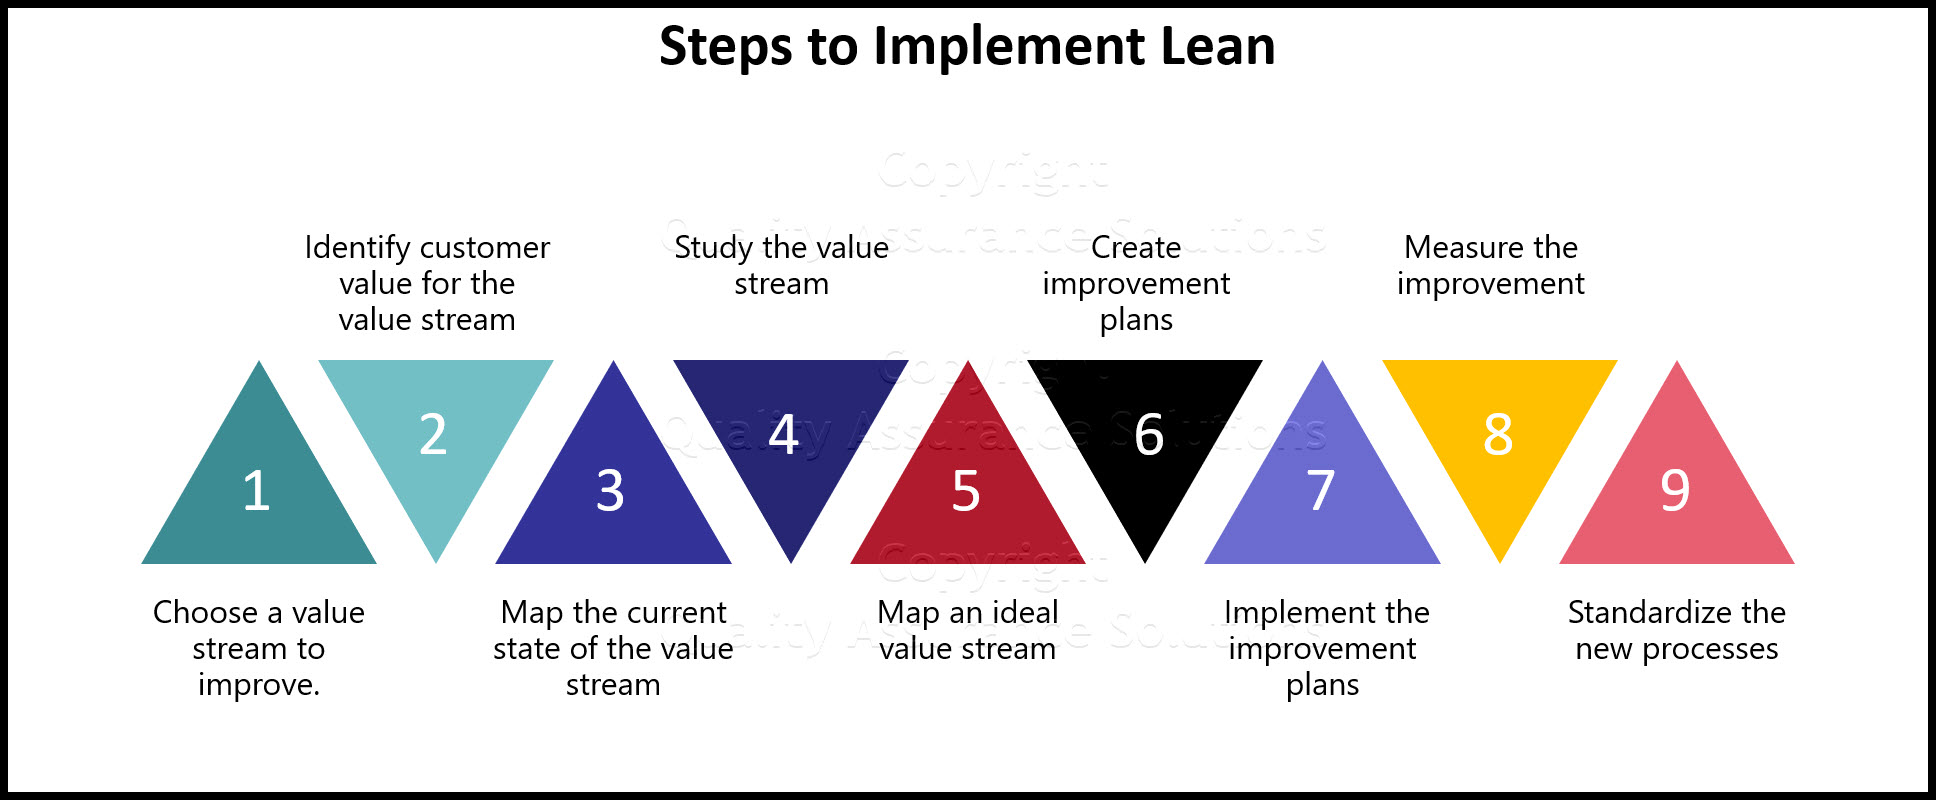
Lean Thinking
Become a friend with lean thinking. Learn the steps to implement the lean process.
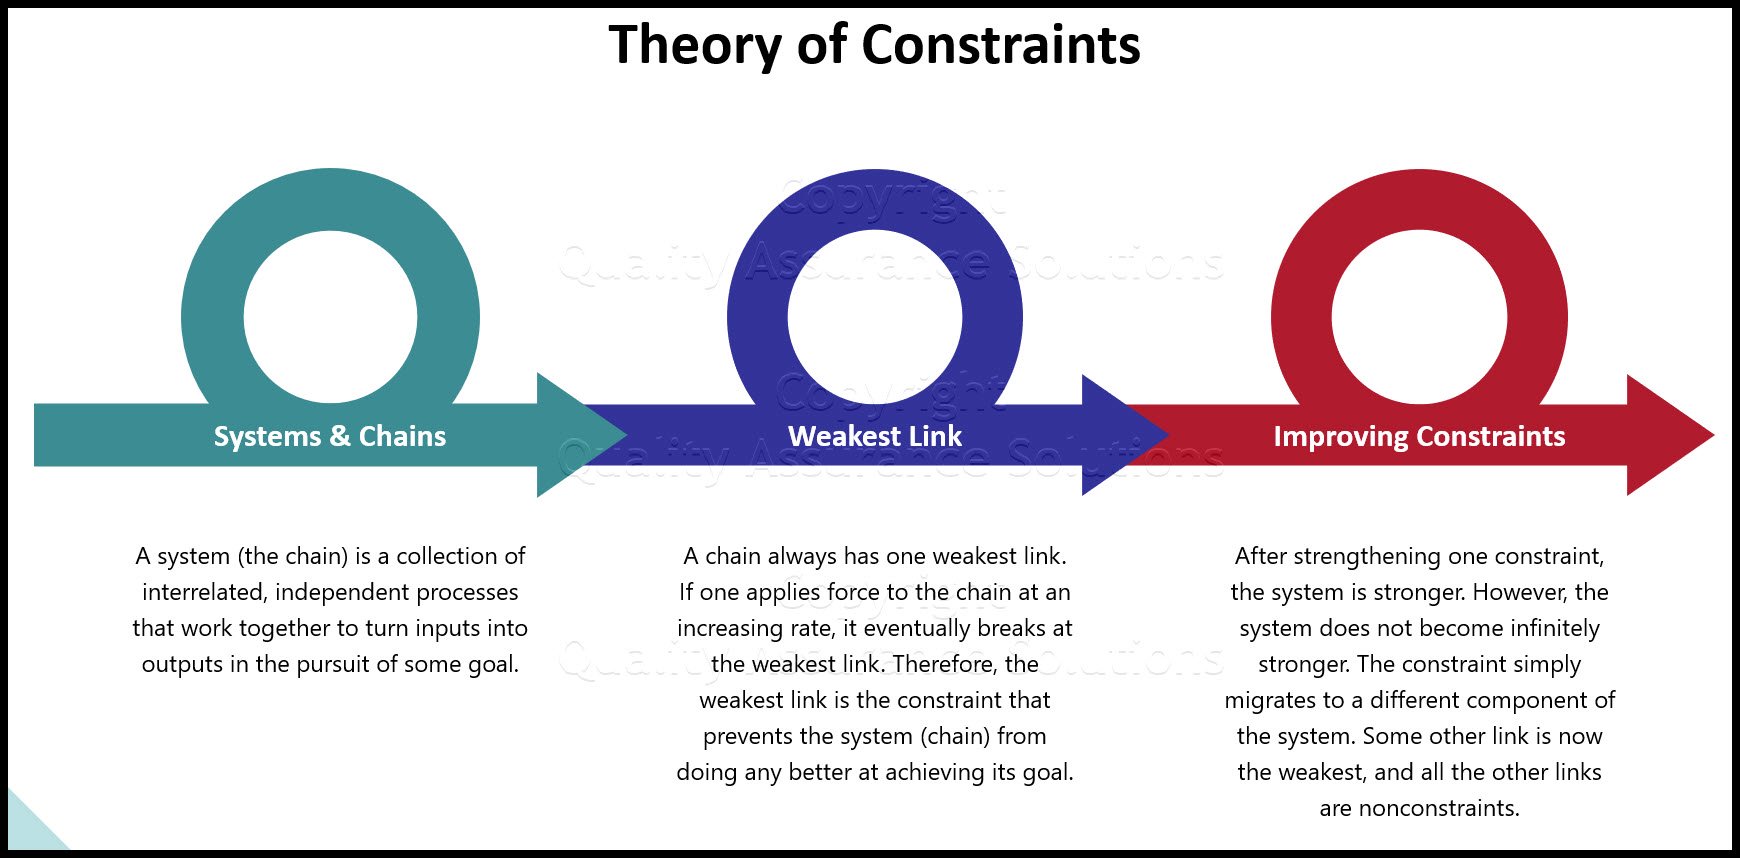
Theory of Constraints Concepts and Details
See our article on Theory of Constraints. Every system keeps at least one constraint that limits the system outputs
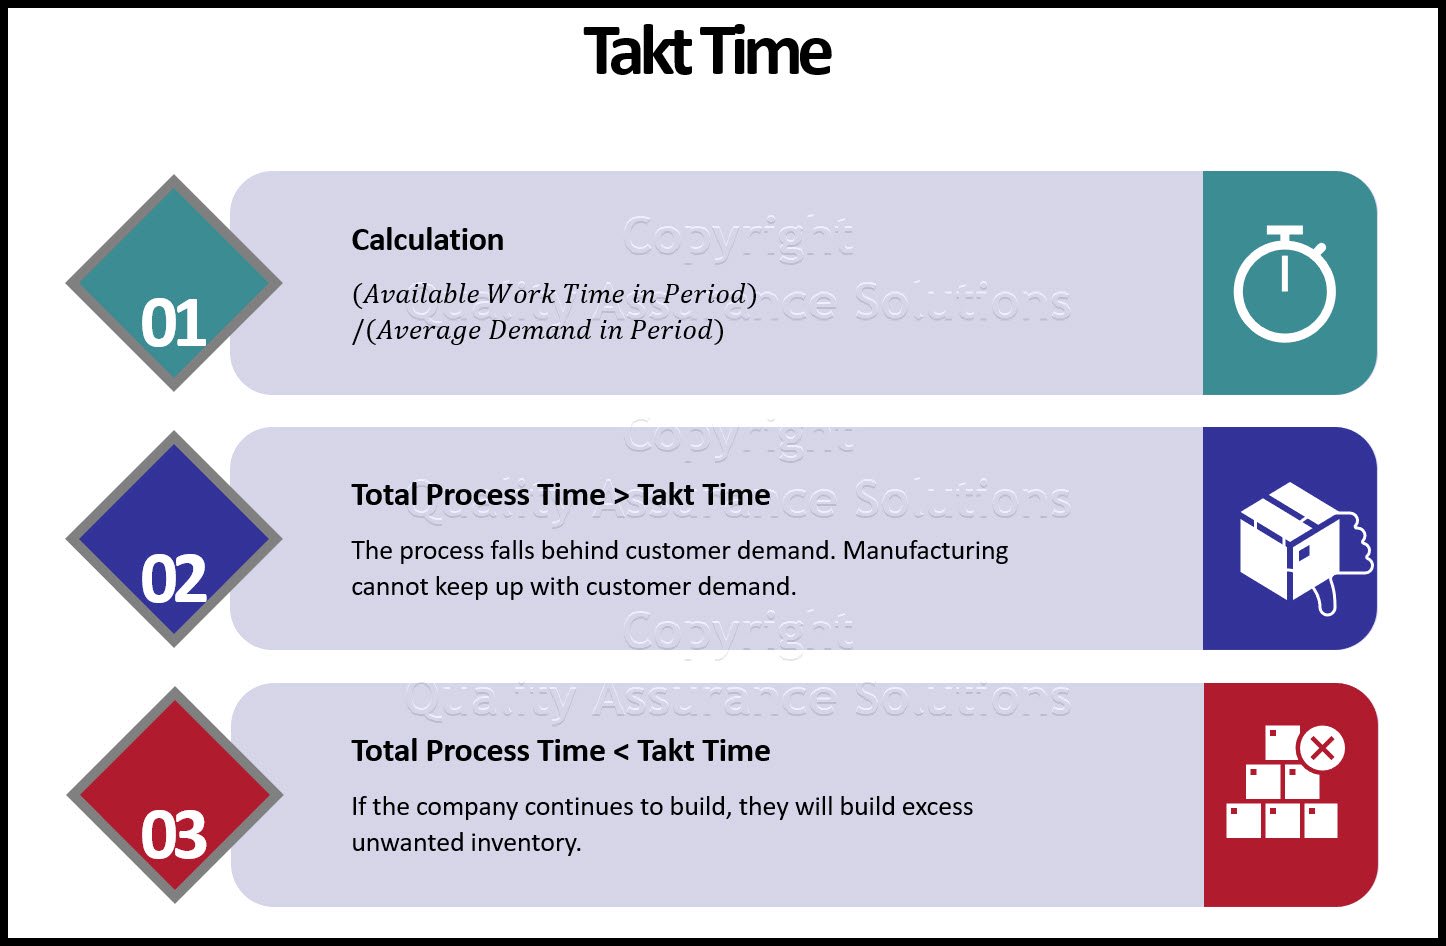
Takt Time
Takt Time is defined as :The rate at which the end product or service must be produced
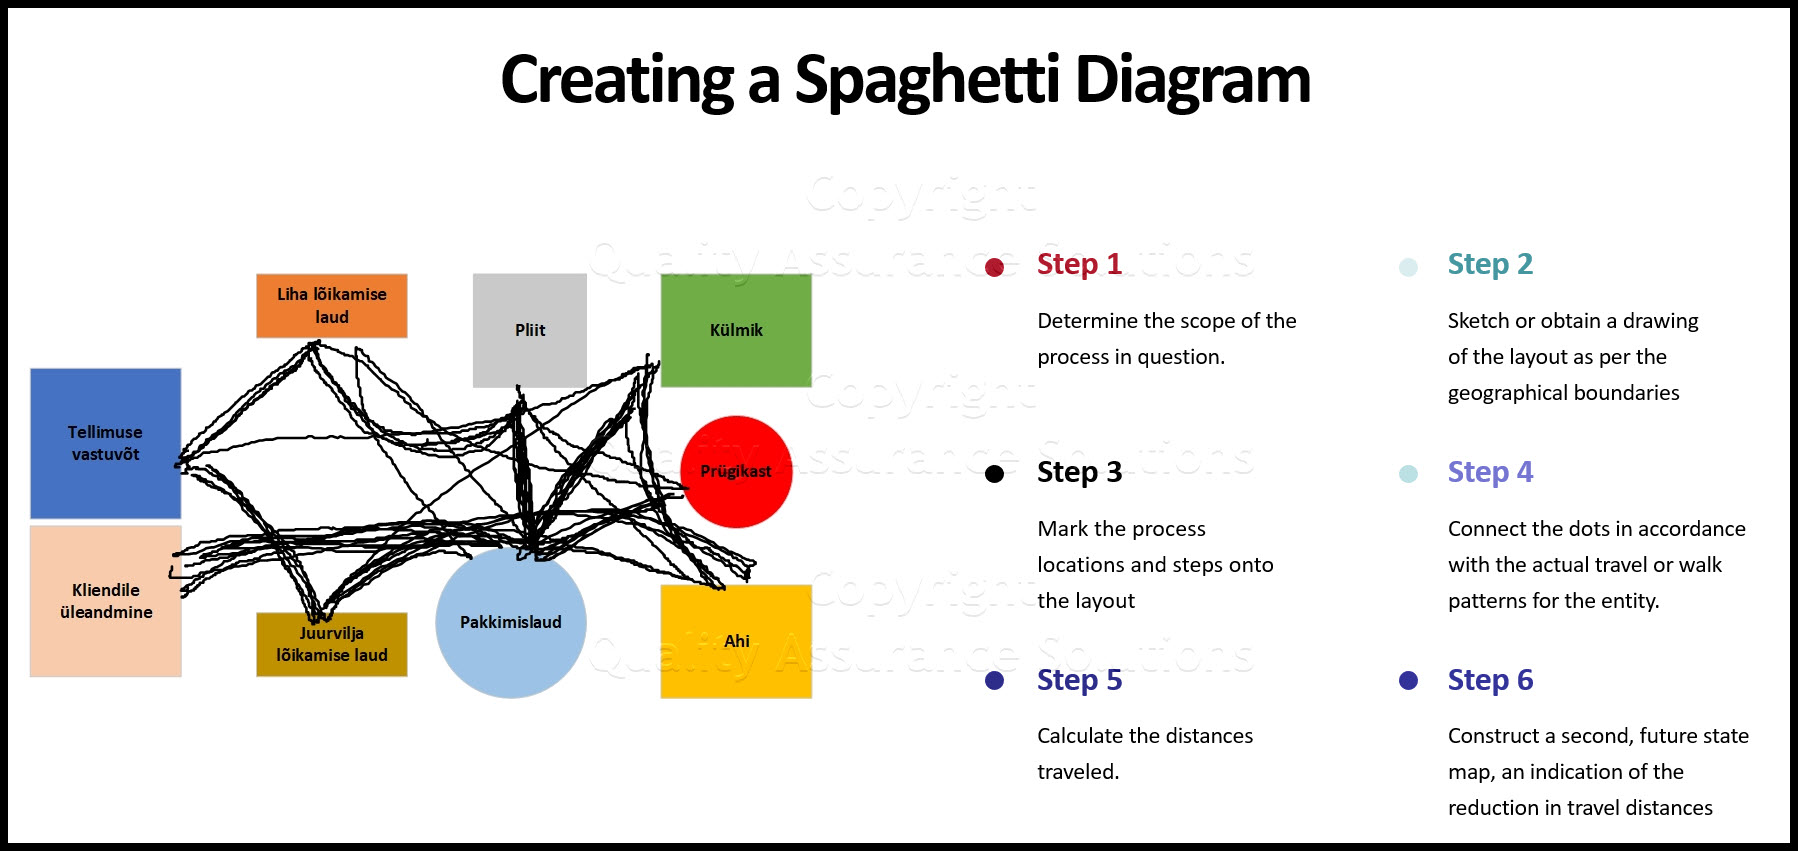
Spaghetti
Spaghetti Map or Physical Process Map is the simplest Lean Sigma tool. It demonstrates the physical flow of an entity or multiple entity types
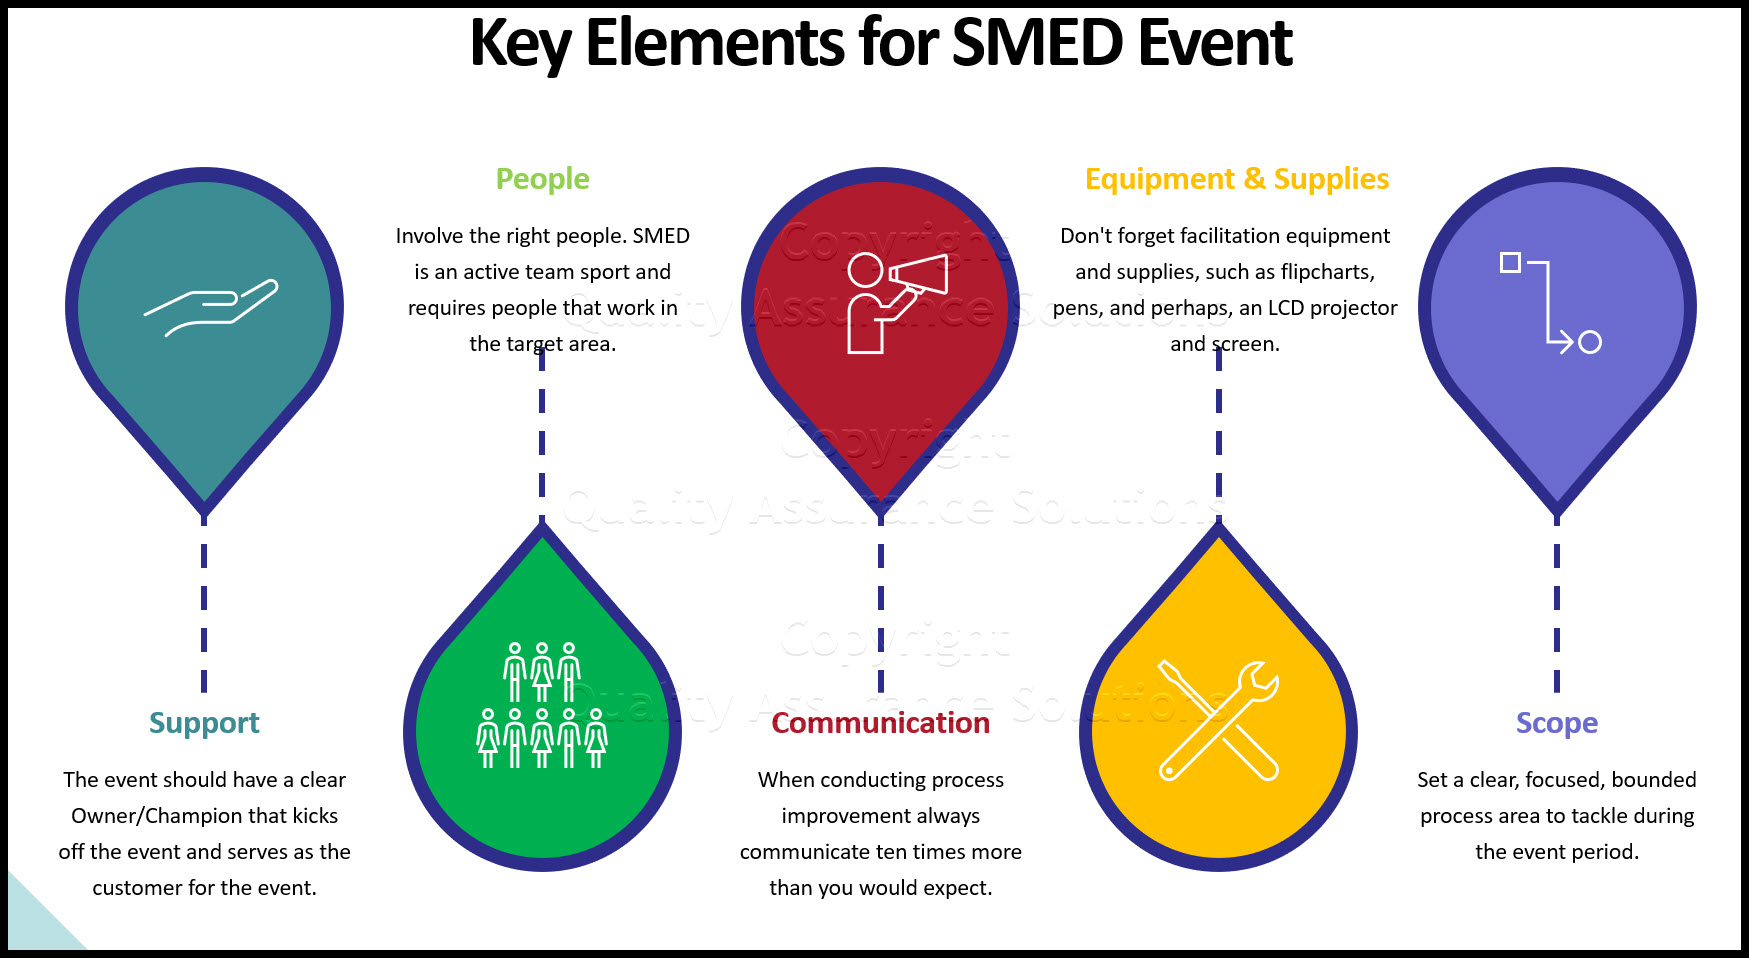
SMED
SMED: Rapid changeover or rapid setup is also known asSingle Minute Exchange of Dies (SMED) and was devised by ShigeoShingo
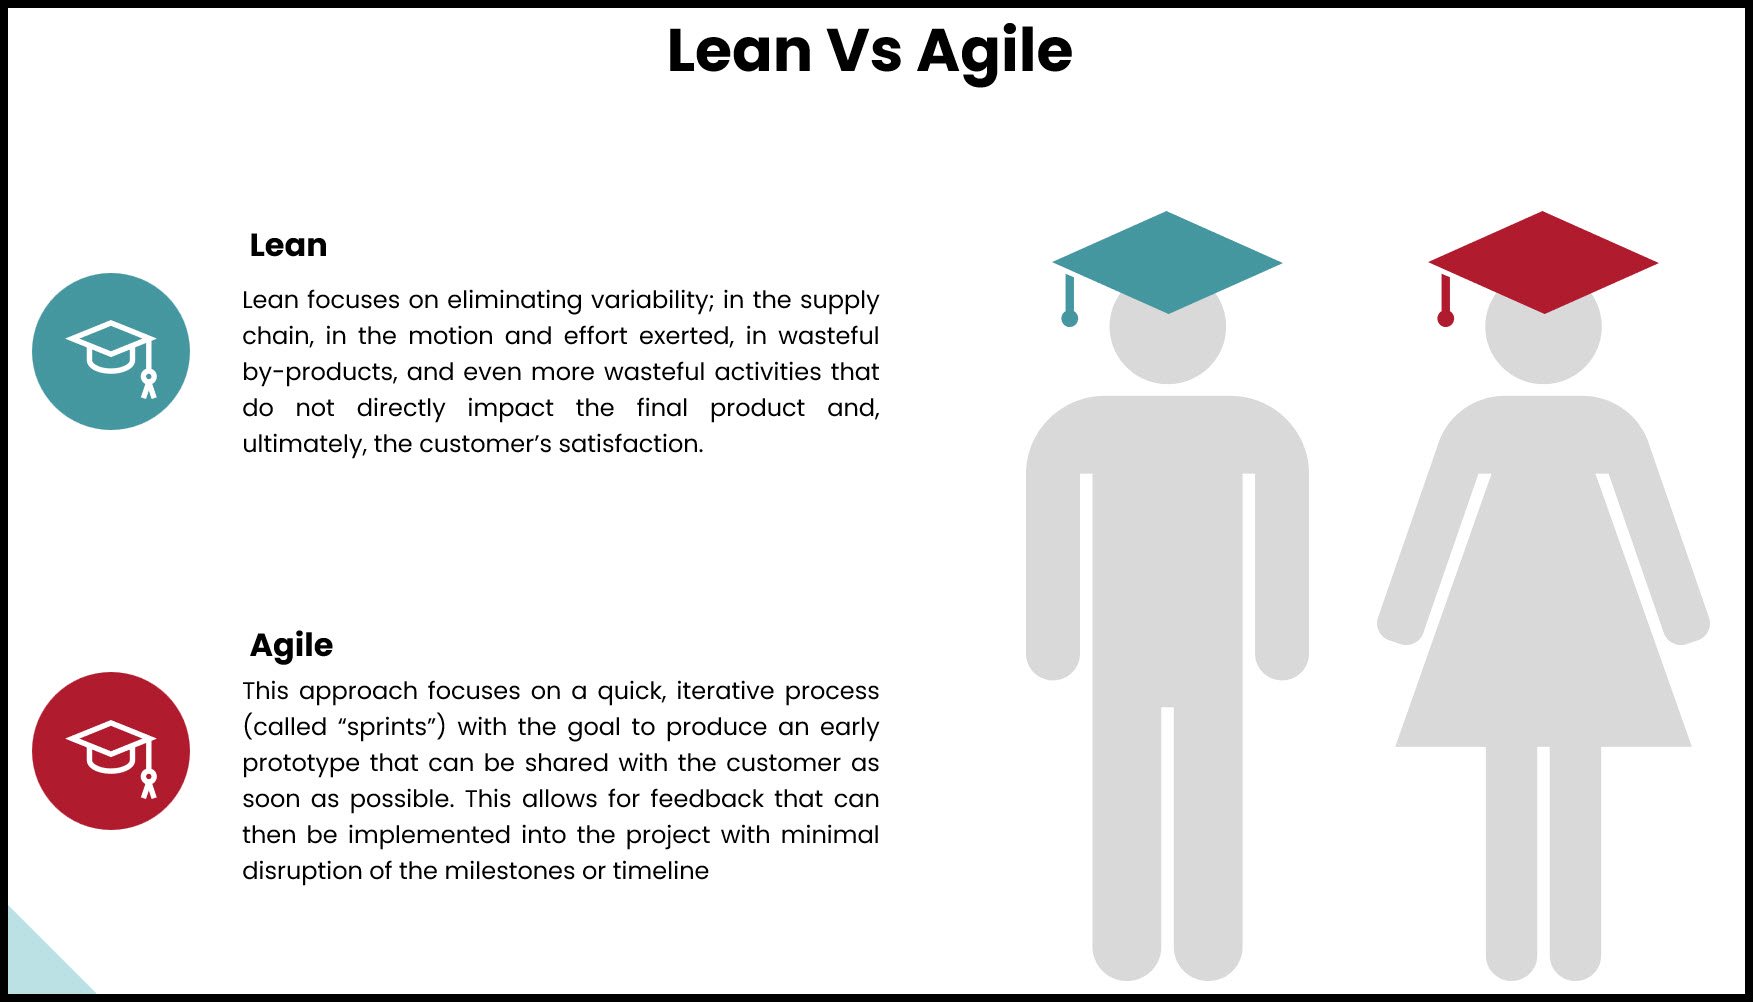
Lean vs Agile
Lean vs Agile: Which process methodology is best for your industry?
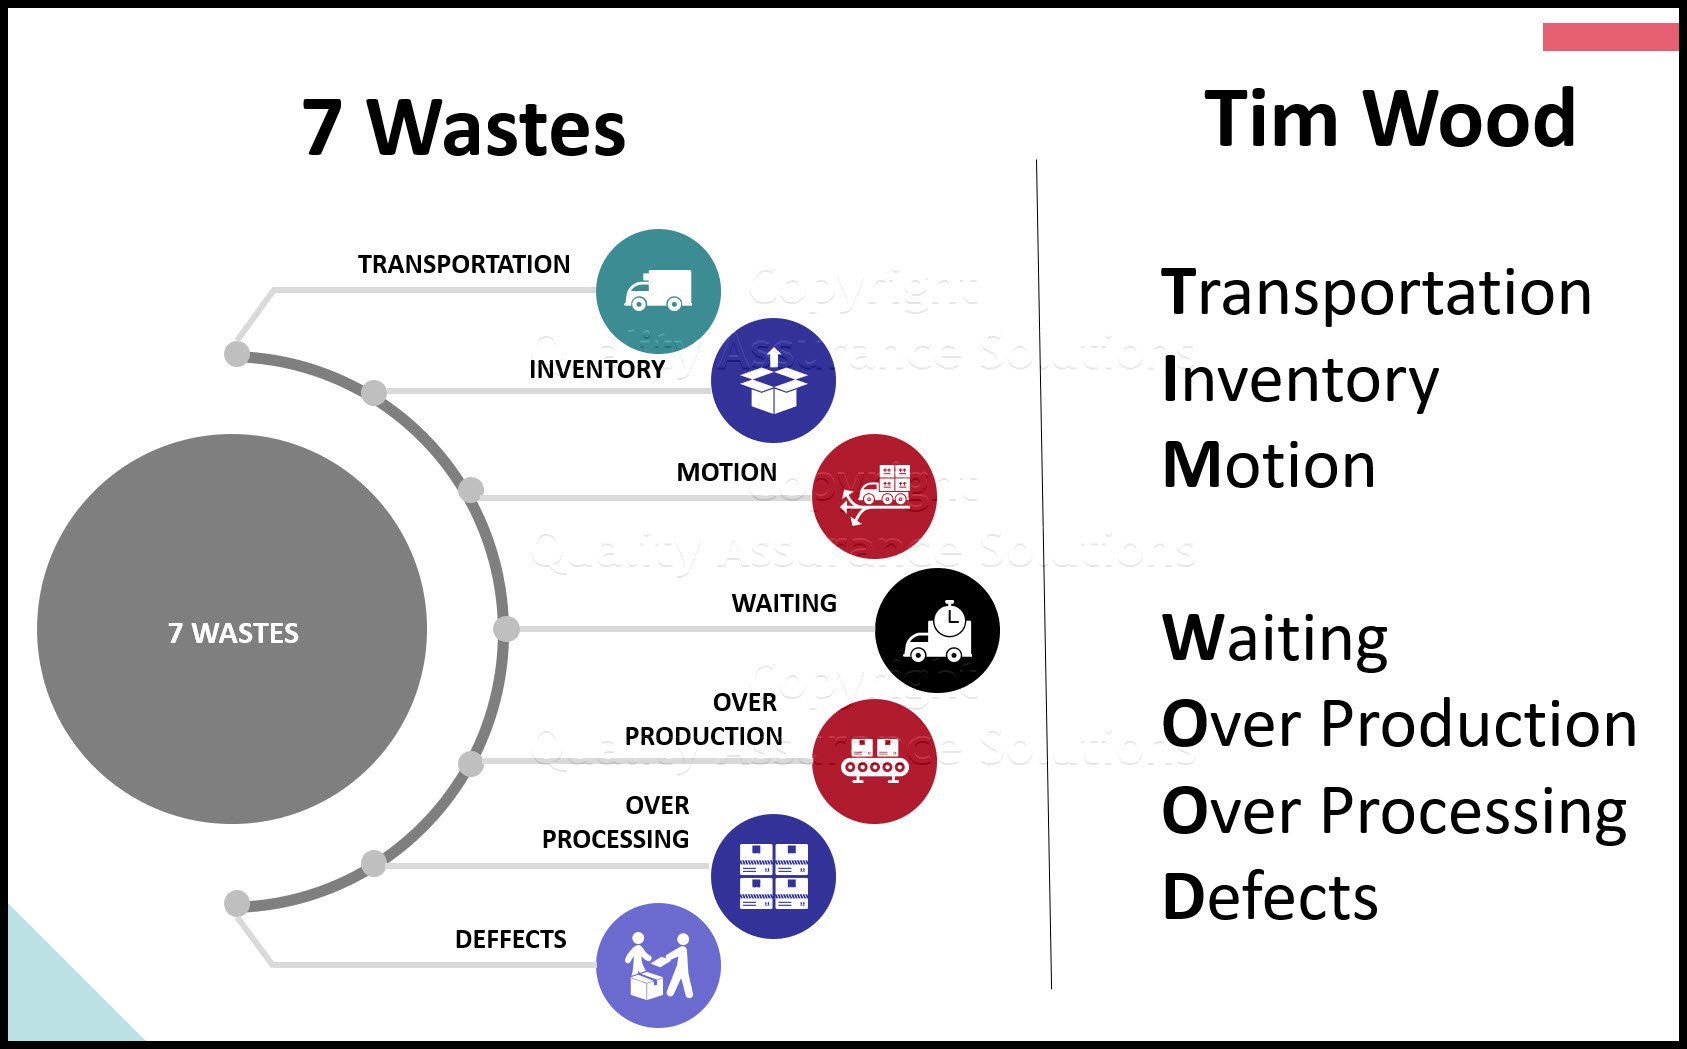
The 7 Wastes of Lean
Learn the 7 wastes of Lean, the Tim Wood acronym, and how they affect your company's bottom line and the actions to counter these wastes.
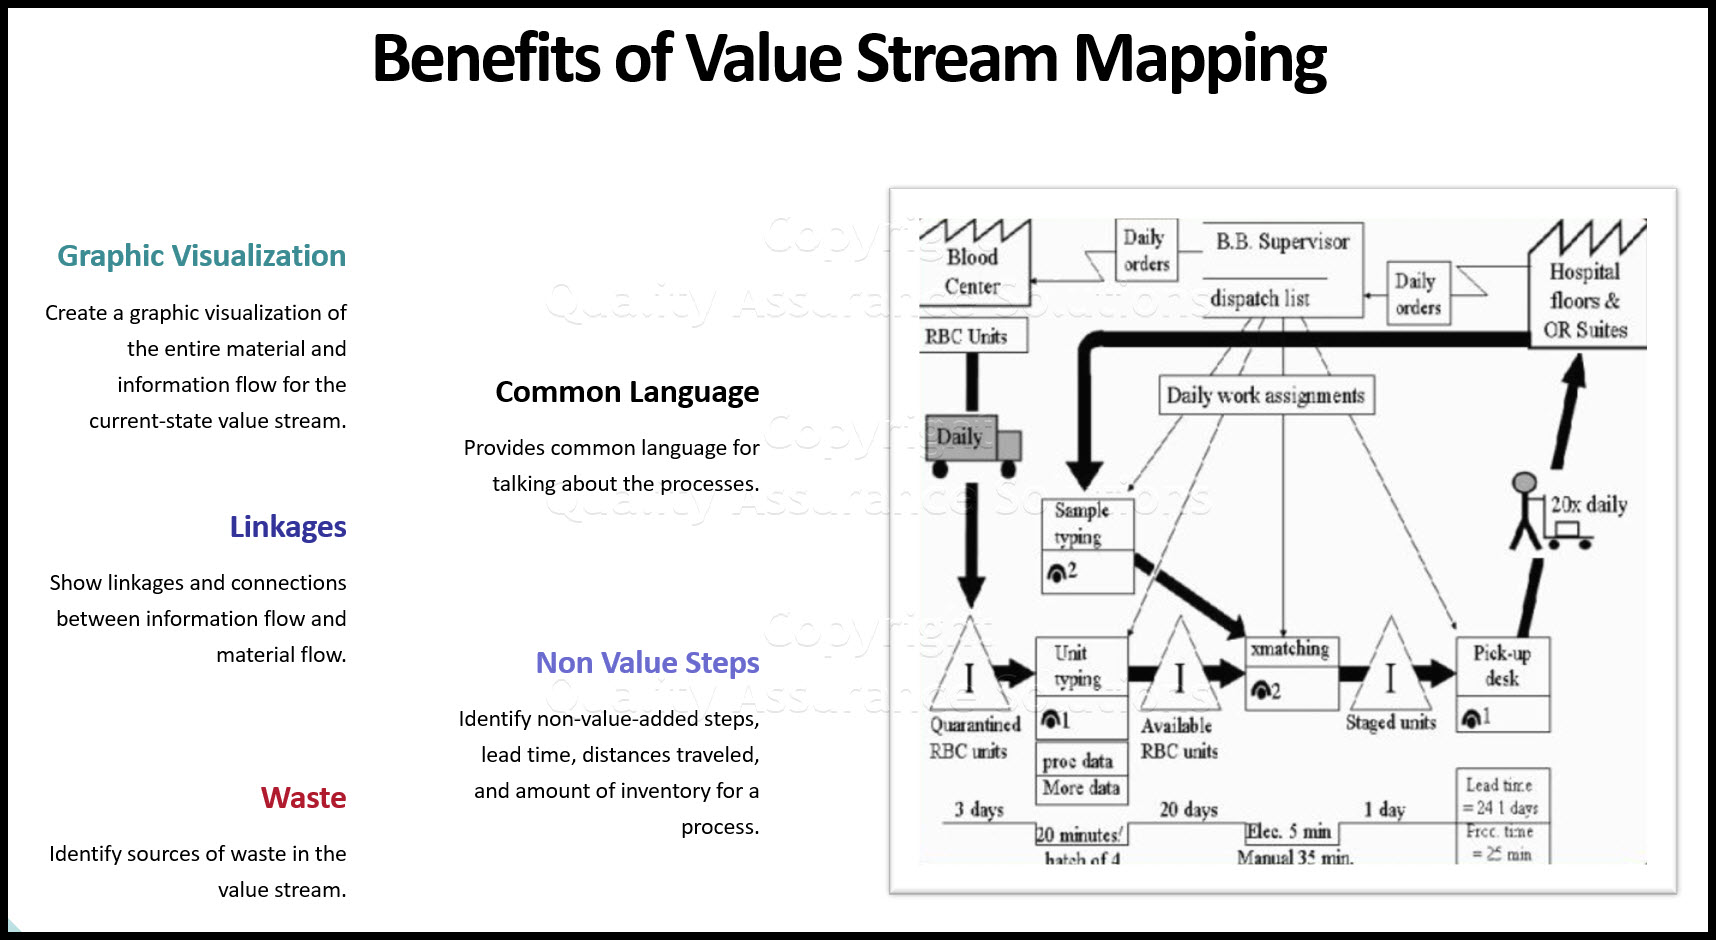
Value Stream Mapping
a value stream mapping is the first step required in any lean improvement initiative
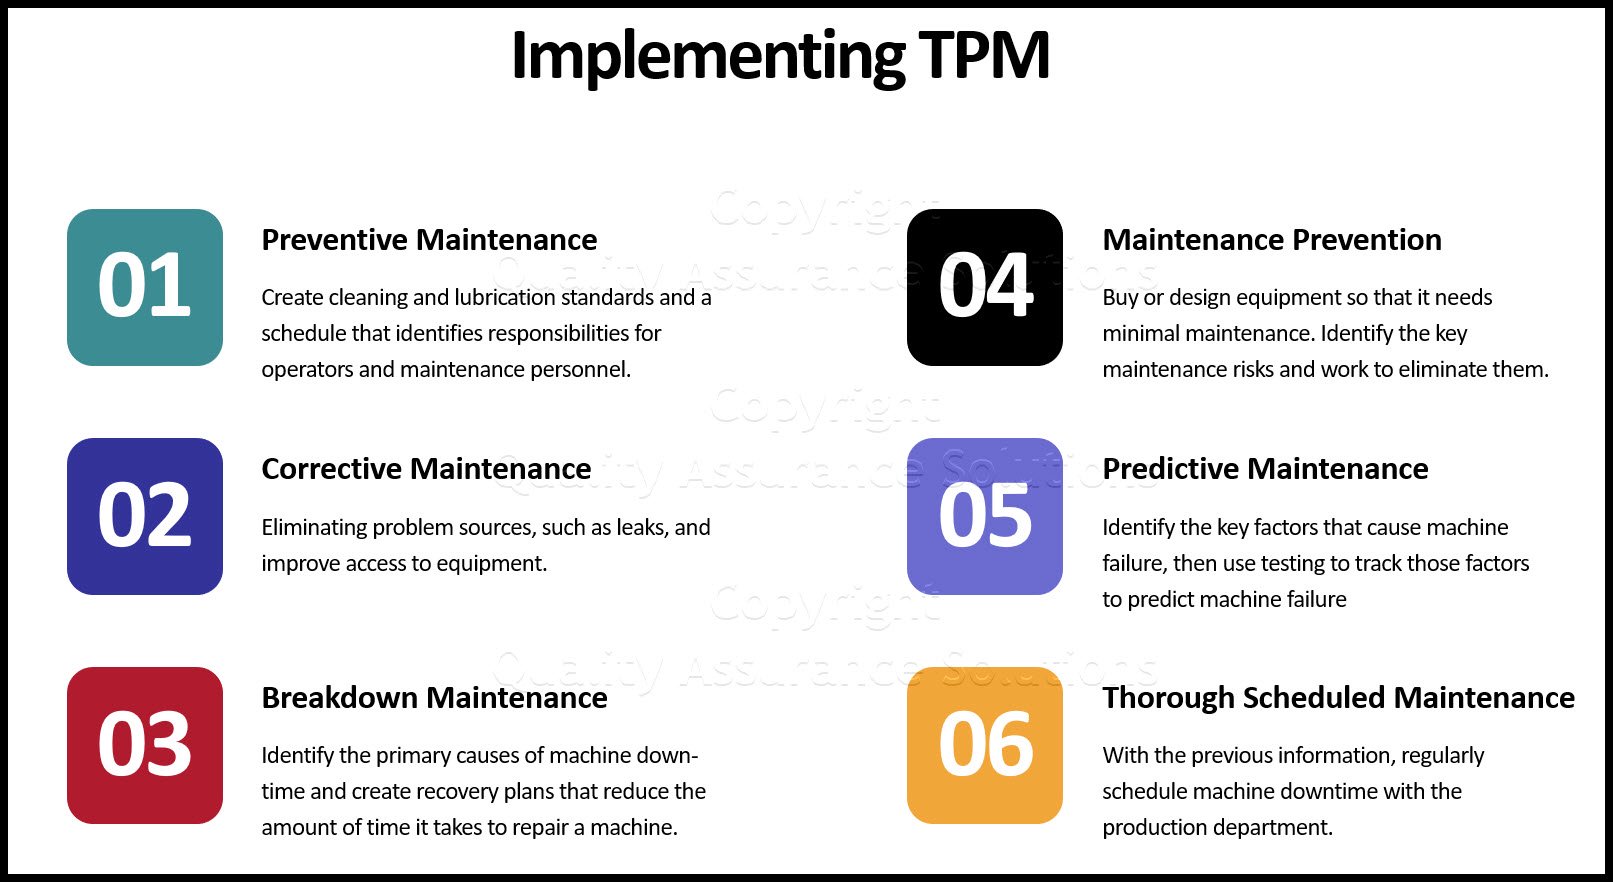
TPM
Total Productive Maintenance: Learn the implementation steps for full TPM at your facillity.
|
Quality Assurance Solutions Robert Broughton (805) 419-3344 USA |
 |


 |
Software, Videos, Manuals, On-Line Certifications | |
|
|
An Organizational Task Management System. Projects, Meetings, Audits & more | |
|
|
Corrective Action Software | |
 |
Plan and Track Training | |
 |
AQL Inspection Software |
 |
450+ Editable Slides with support links | |
 |
Learn and Train TRIZ | |
 |
Editable Template | |
 |
Templates, Guides, QA Manual, Audit Checklists | |
 |
EMS Manual, Procedures, Forms, Examples, Audits, Videos | |
 |
On-Line Accredited Certifications Six Sigma, Risk Management, SCRUM | |
|
|
Software, Videos, Manuals, On-Line Certifications |