Tree Diagram

Description:
You may also know the Tree diagram as a systematic diagram, tree analysis, analytical tree, or hierarchy diagram. The diagram starts with one item that branches into two or more, each of which branch into two or more, and so on. It looks like a tree, with a trunk and multiple branches. You used it to break down broad categories into finer and finer levels of detail. Developing the tree diagram helps you move your thinking from generalities to specifics.
TrainingKeeper Software. Keep, organize and plan all your employees' training and activities. Software includes multi-user support with reports, certs, and calendars.
When To Use:
- When addressing an known issue with a broad span and you must move to specific details, such as developing logical steps to achieve an objective.
- When developing actions to carry out a solution or other plan.
- When analyzing processes in detail.
- When probing for the root cause of a problem.
- When evaluating implementation issues for several potential solutions.
- After an affinity diagram or relations diagram has uncovered key issues.
- As a communication tool, to explain details to others.

Your easy to edit ISO 9001:2015 Quality Assurance Manual.
Construction:
1. Develop a statement of the goal, project, plan, problem or the item under study. Write it at the top (for a vertical tree) or far left (for a horizontal tree) of your work surface.
2. Ask a targeted question that leads you to the next level of detail. For example:
- For a goal, action plan or work breakdown structure: "What tasks must be done to accomplish this?" or "How can this be accomplished?"
- For root-cause analysis: "What causes this?" or "Why does this happen?"
- For gozinto chart: "What are the components?" (Gozinto literally comes from the phrase "What goes into it?")
3. Brainstorm all possible answers. If you previously conducted an affinity diagram or relationship diagram , take ideas from there. Write each idea in a line below (for a vertical tree) or to the right of (for a horizontal tree) the first statement. Show the links between the tiers with arrows.
4. Complete a "necessary and sufficient" check. Are all the items at this level necessary for the level above? If all the items at this level were present or accomplished, would they be sufficient for the one on the level above?
5. Each of the new branches now becomes the subject: a goal, objective or problem statement. For each one, ask a targeted question again to uncover the next level of detail. Create another tier of statements and show the relationships to the previous tier of ideas with arrows. Do a "necessary and sufficient check" for each set of items.
6. Continue to turn each new idea into a subject statement and ask the question. Do not stop until you reach fundamental elements: specific actions, not divisible components, or root causes.
7. Complete a "necessary and sufficient" check of the entire diagram. Are all the items necessary for the objective? If all the items were present or accomplished, would they be sufficient for the objective?

8D Manager Software with 5D, 8D, 9D, and RMA report generator. Corrective action software for every company needs.
Tree Diagram Example
The Pearl River, NY School District, a 2001 recipient of the Malcolm Baldrige National Quality Award , uses a tree diagram to communicate how district-wide goals are translated into sub-goals and individual projects. They call this connected approach The Golden Thread.
The district has three fundamental goals. The first, to improve academic performance, is partly shown in the figure below.
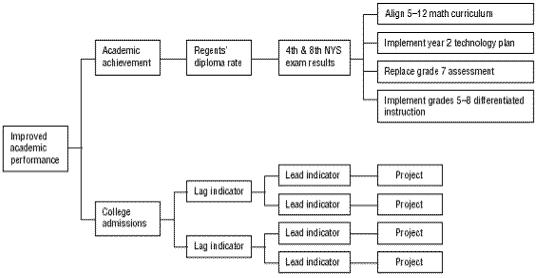
District leaders identified two strategic objectives that, when accomplished, will lead to improved academic performance: academic achievement and college admissions.
Lag indicators are long-term and results-oriented. The lag indicator for academic achievement is Regents' diploma rate: the percent of students receiving a state diploma by passing eight Regents' exams.
Lead indicators are short-term and process-oriented. Starting in 2000, the lead indicator for the Regents' diploma rate was performance on new fourth and eighth grade state tests.
Finally, they defined annual projects, based on cause-and-effect analysis, that improves performance. In 2000-2001, four projects were accomplished to improve academic achievement.
Thus this tree diagram shows an interlocking series of goals and indicators. It traces the causes of system wide academic performance first through high school diploma rates, then through lower grade performance, and back to specific improvement projects.
More Info
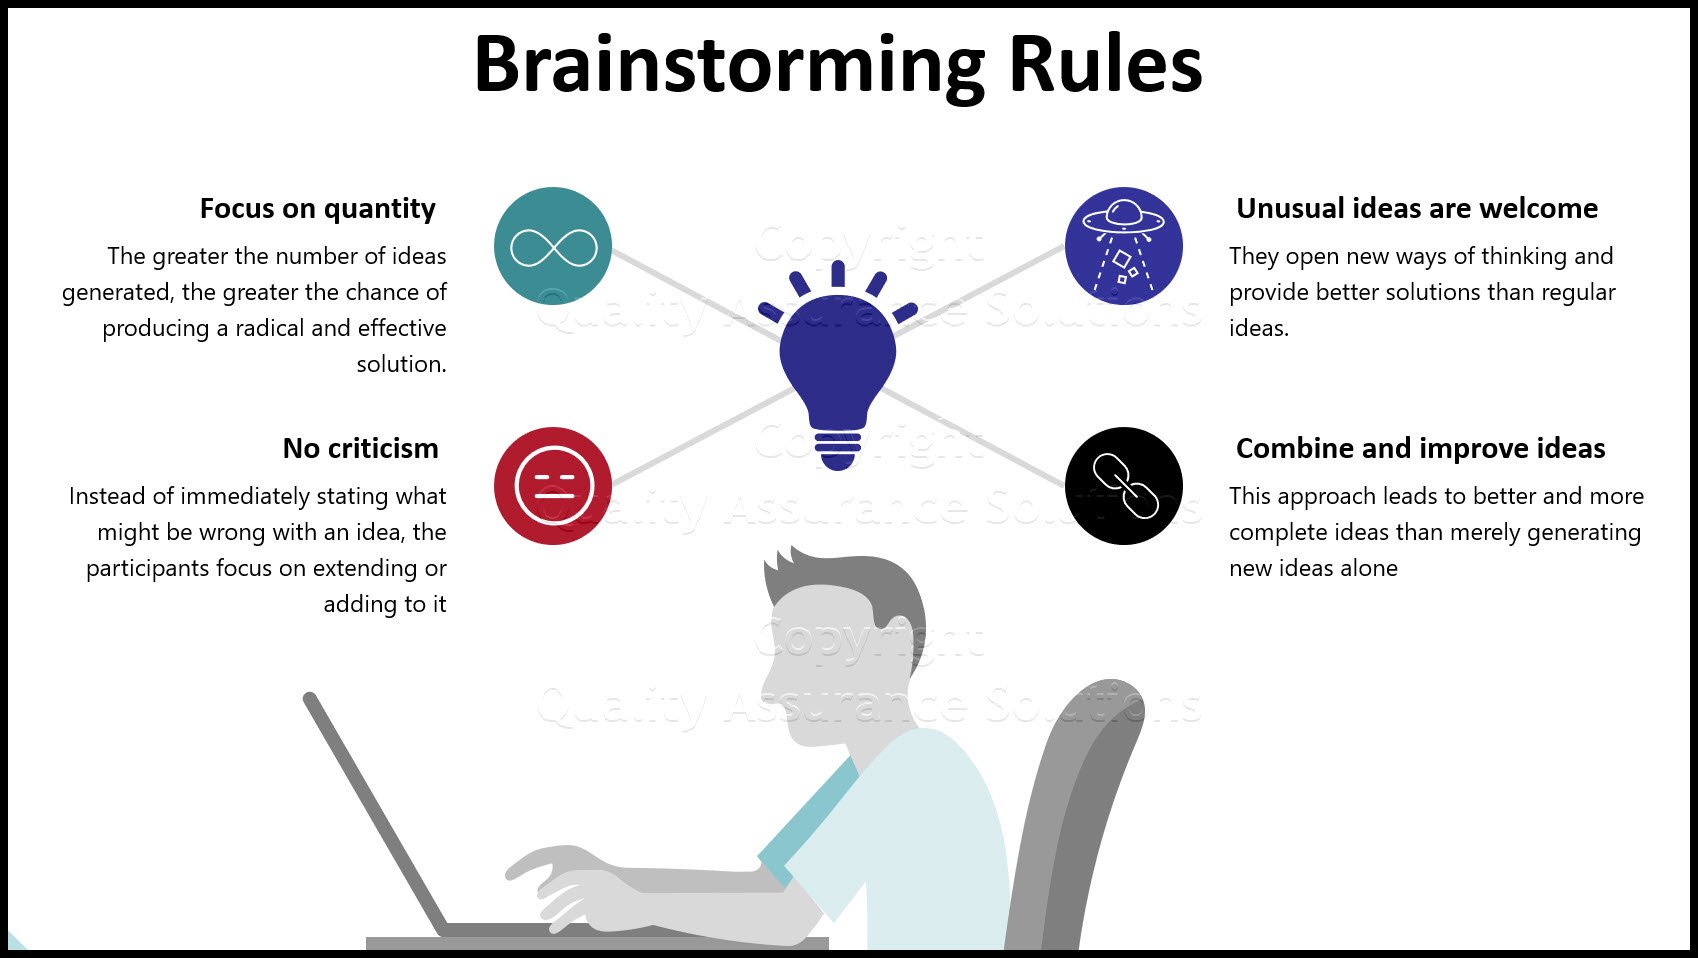
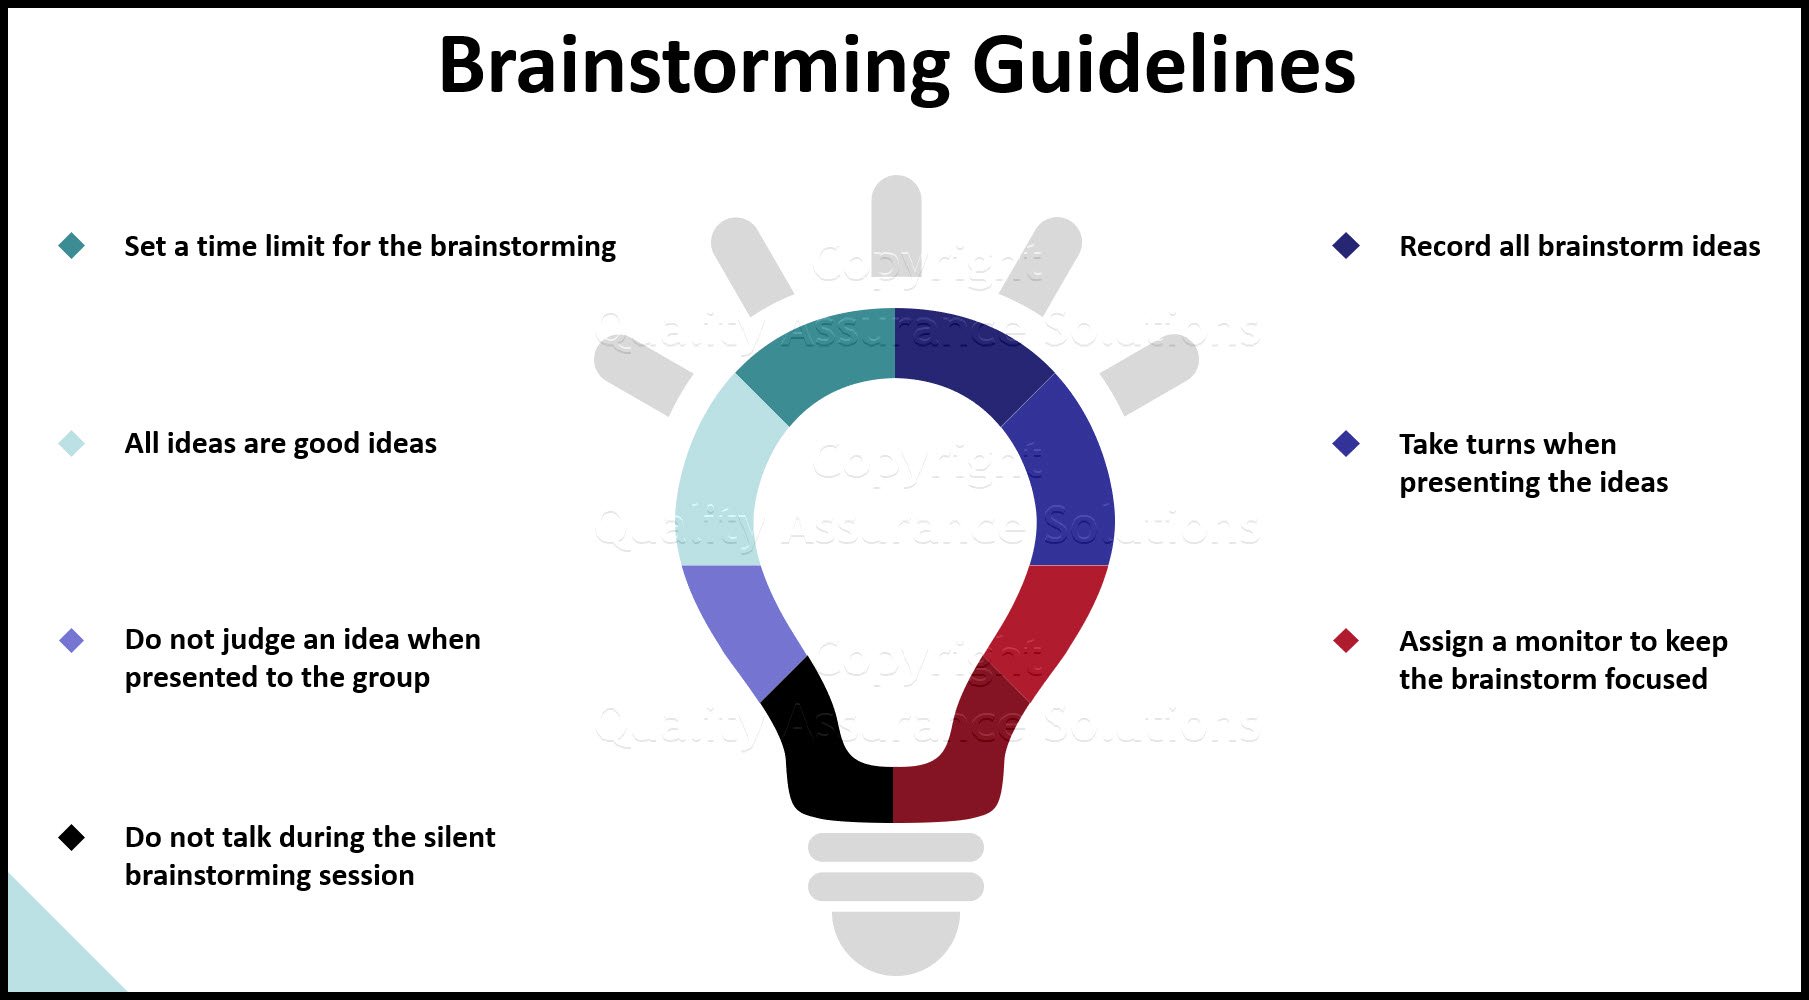
Brainstorming Method
Learn the brainstorming process steps, guidelines and multivoting
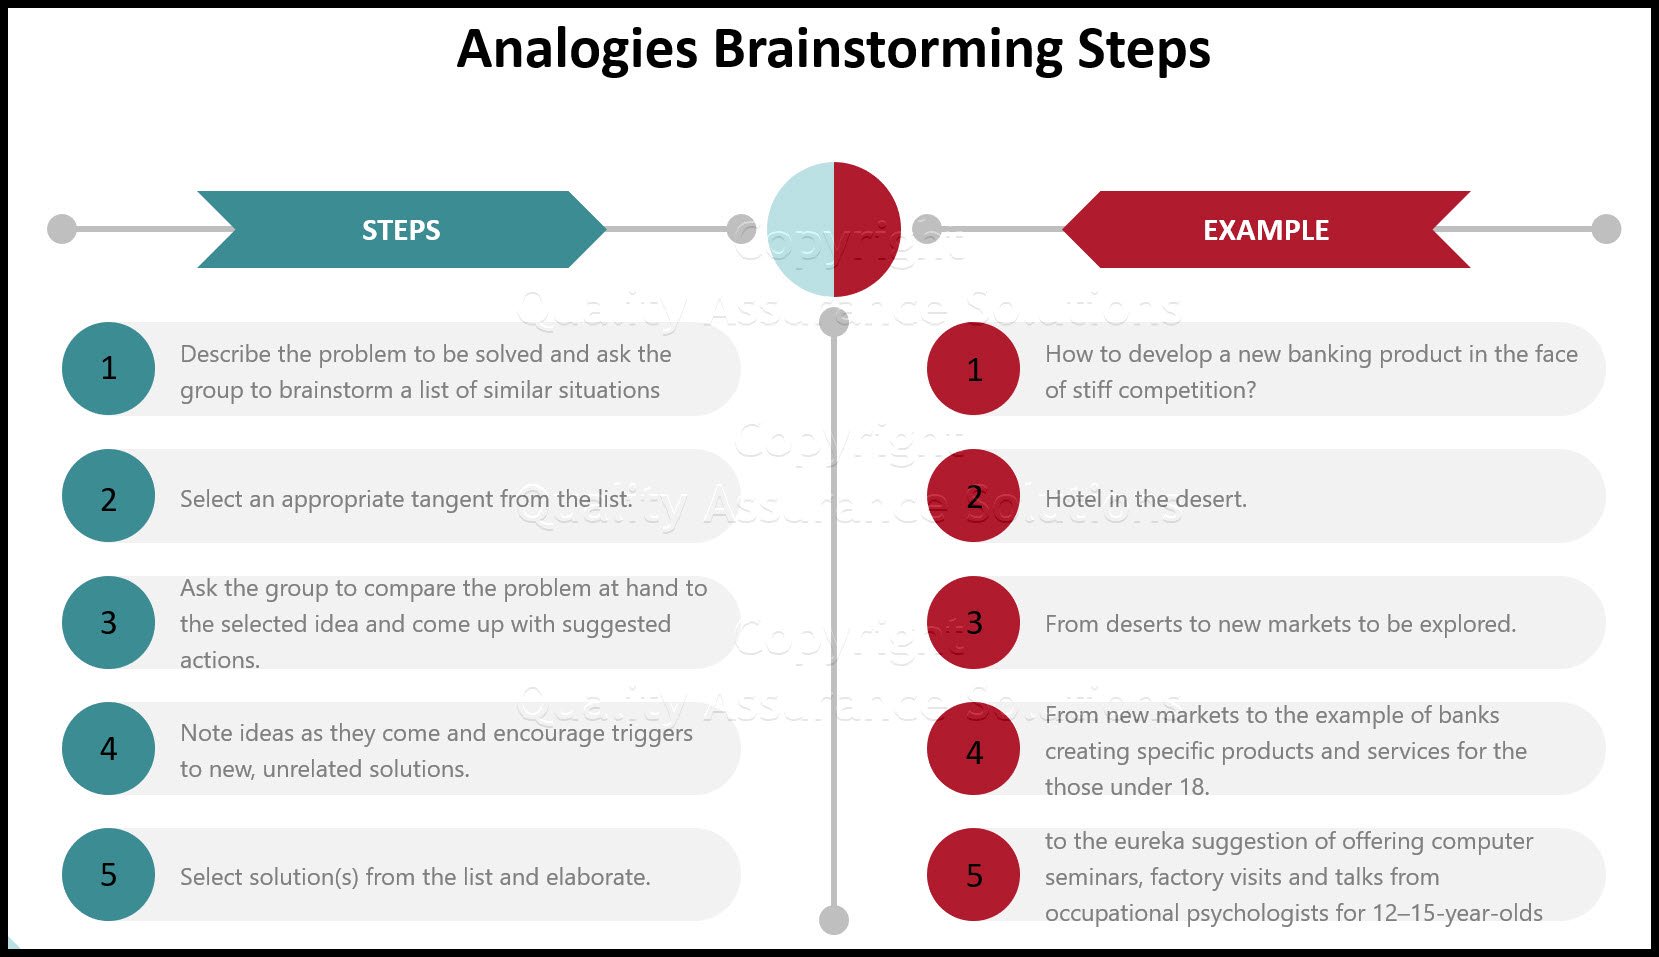
Analogies Brainstorming Tool
Learn the steps to using the Analogies Brainstorming Tool. This article inlcudes an example of this tool.
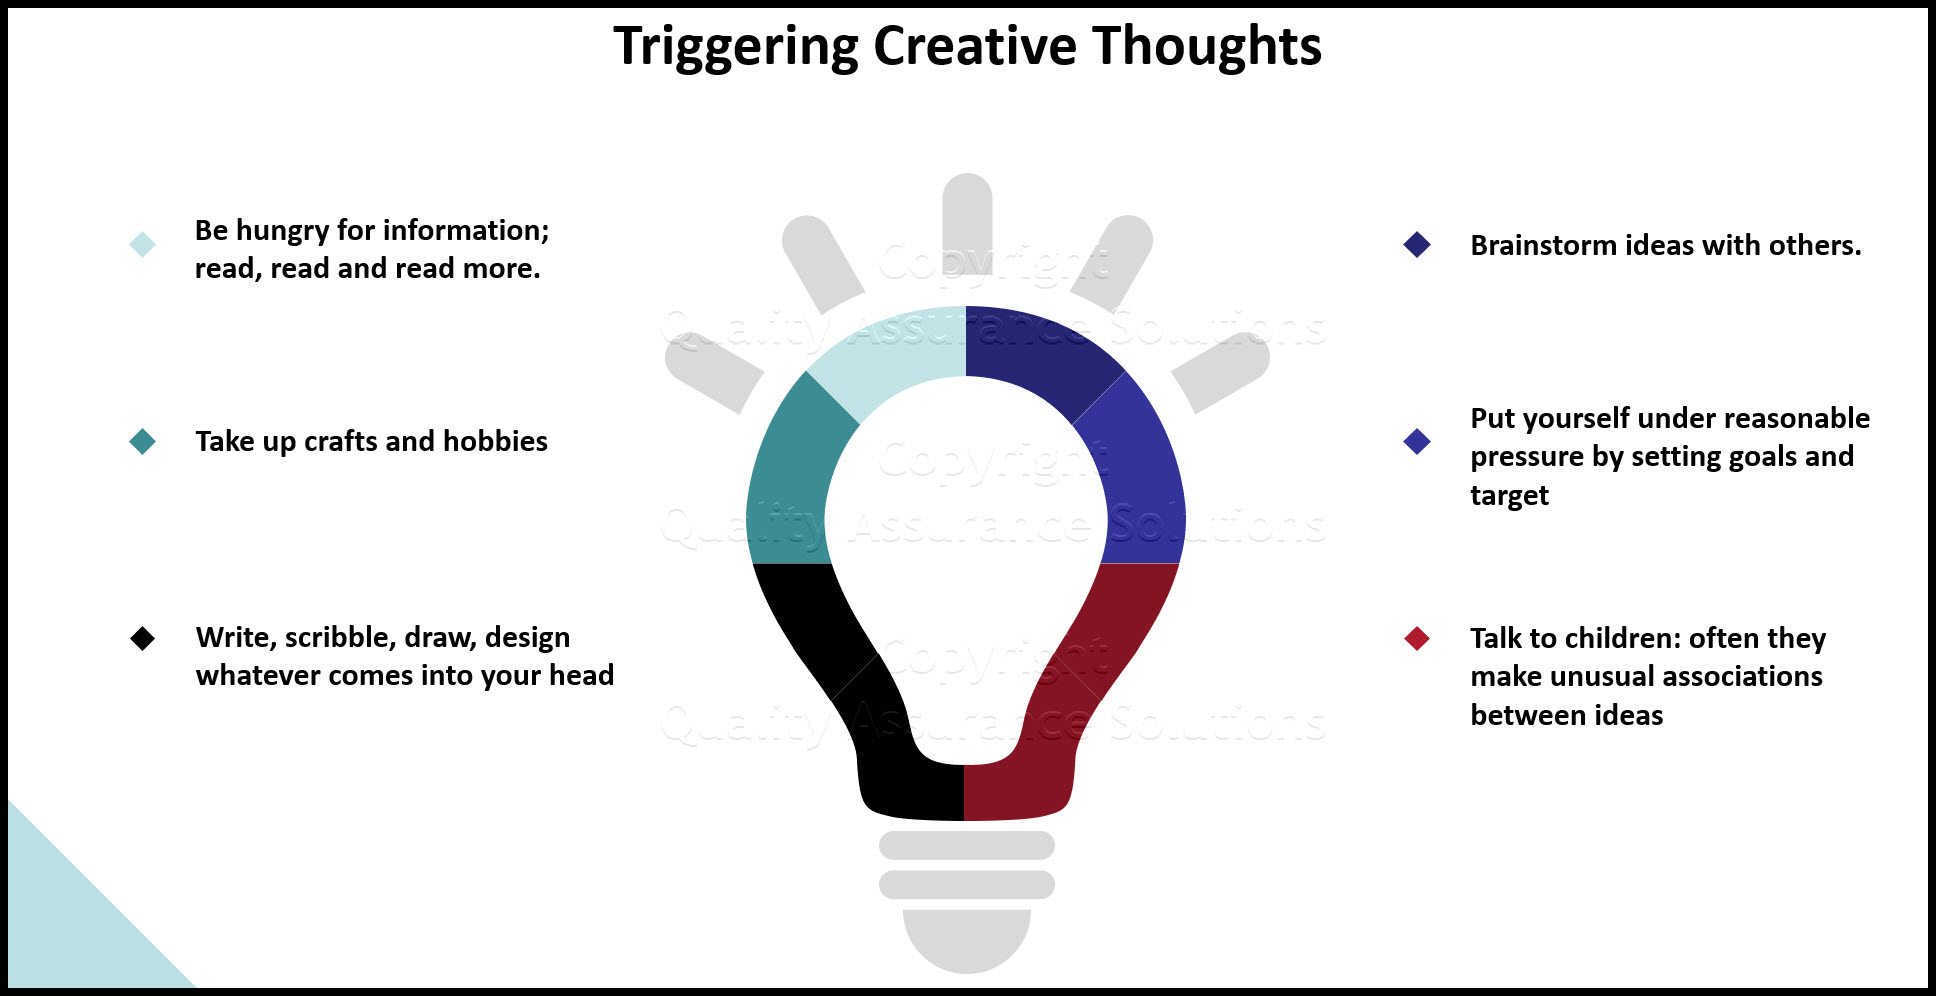
Creative Thinking
Learn an exercise and triggers for creative thinking
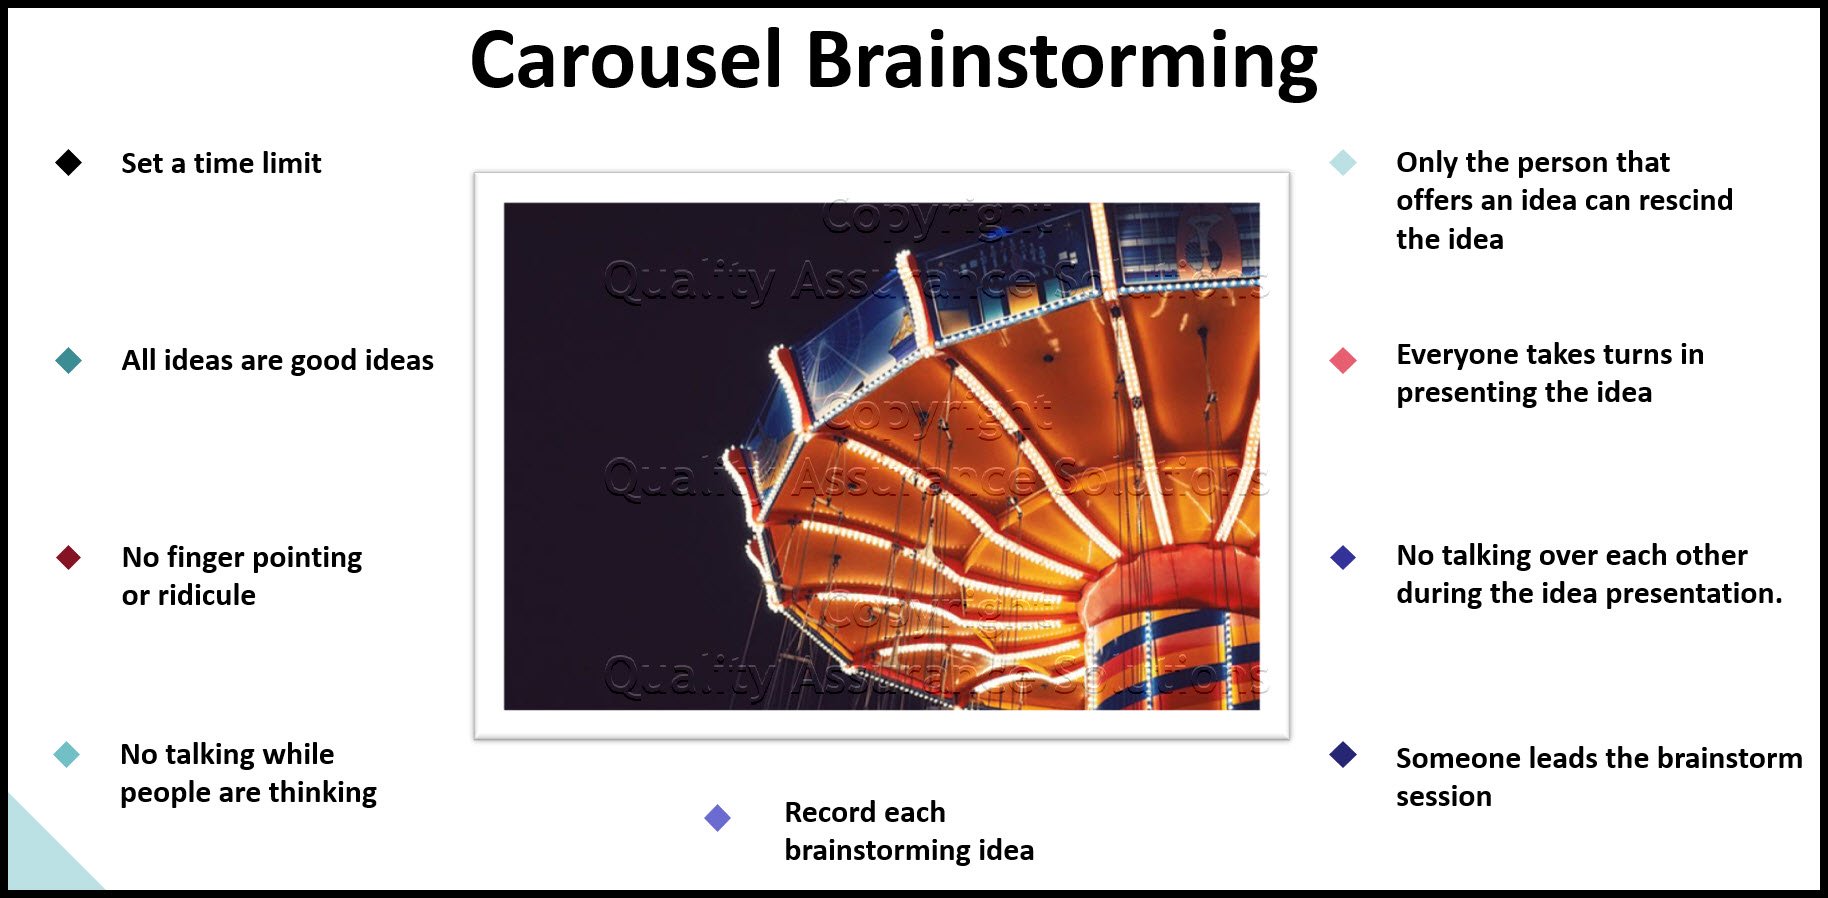
Carousel Brainstorming for Idea Generation and Problem Solving.
Carousel brainstorming is ideal for group idea generation and ideal for getting a better understanding of the knowledge level of all those involved.
Brainstorming Games Help You Generate Problem Solving Ideas
This work describes possible brainstorming games that you can use for problem solving. These brainstorming activites guide you to generate ideas.
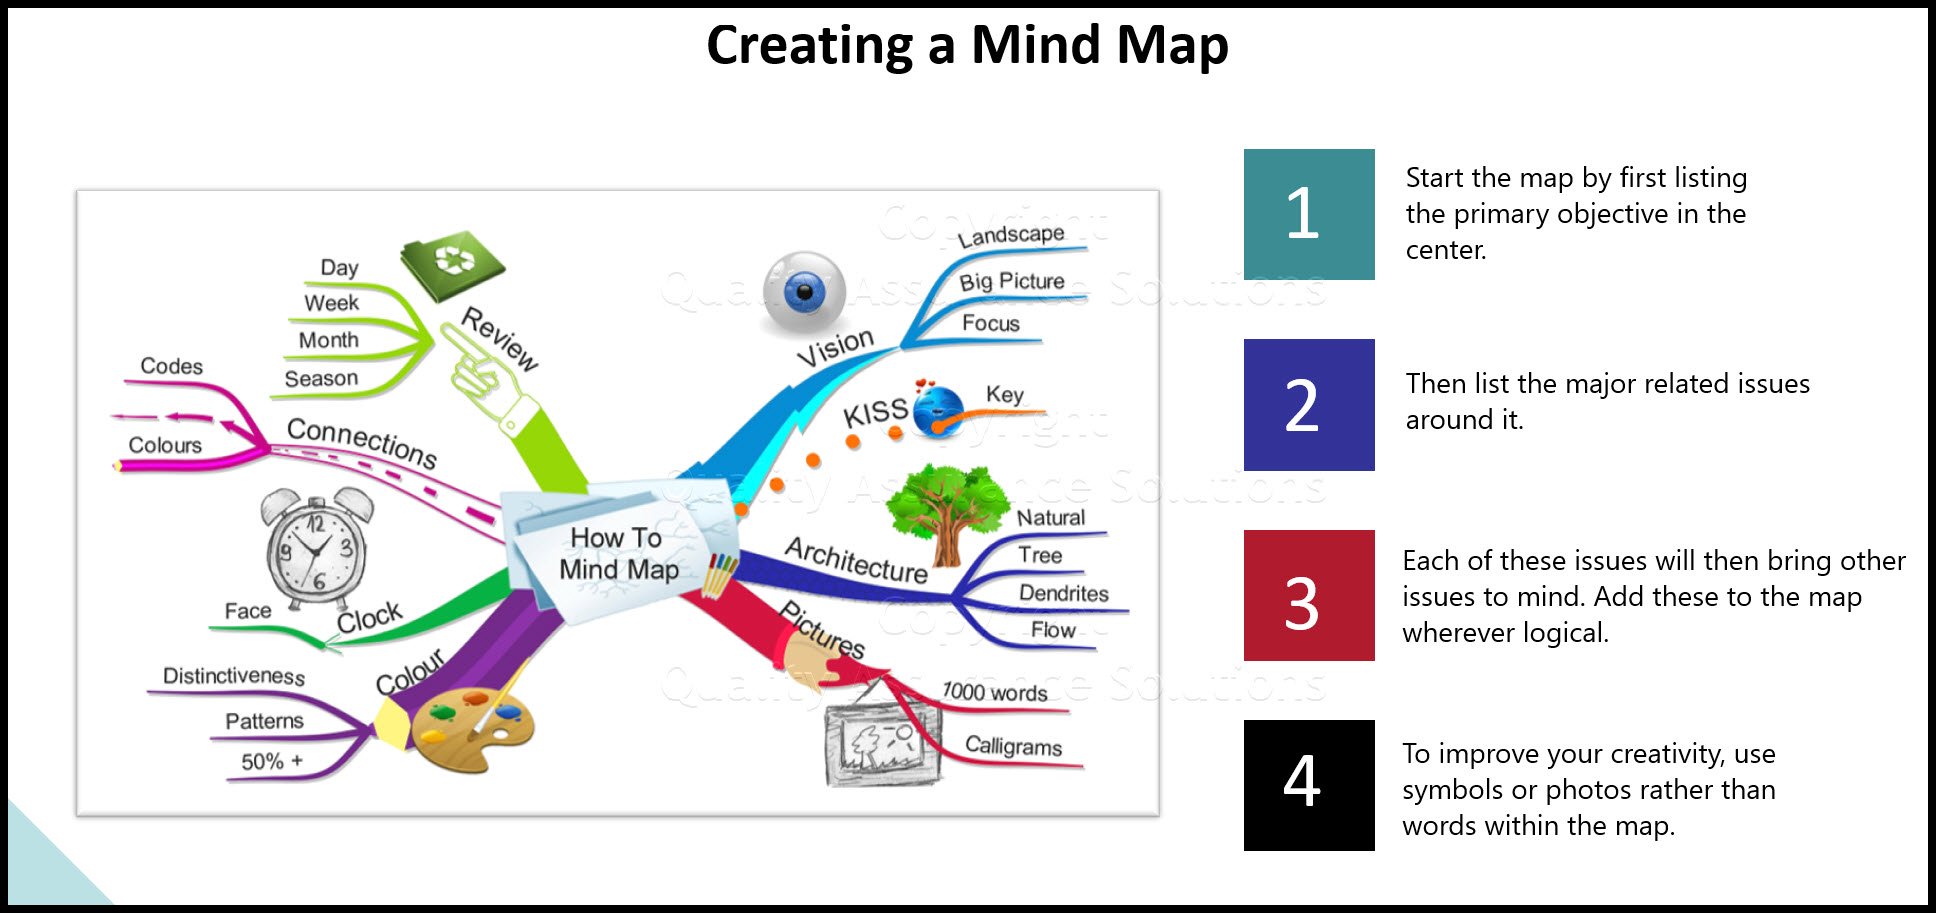
Mind Mapping
Learn the brainstorming mind mapping technique. We provide an example of it in action.
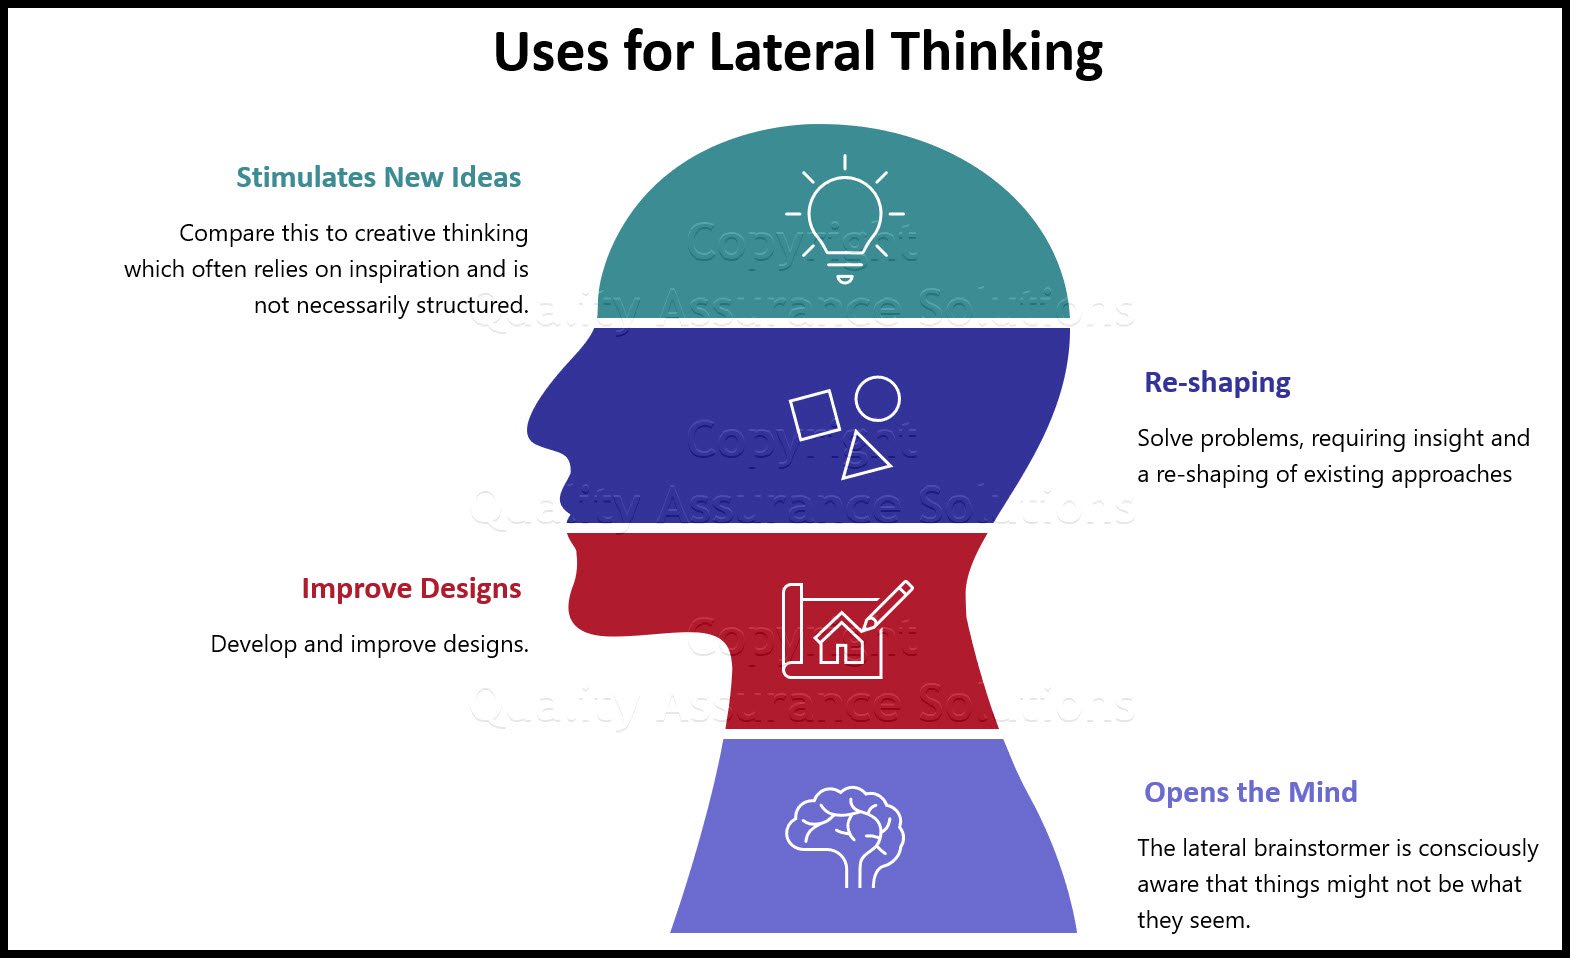
Lateral Thinking
Lateral thinking is closely connected to creative thinking. It generates a wealth of ideas by removing the barriers from following a particular path.
Using the Affinity Diagram
Learn when and how to use the Affinity Diagram
- QAS Home
- Brainstorming
- Tree Diagram
|
Quality Assurance Solutions Robert Broughton (805) 419-3344 USA |
 |


 |
Software, Videos, Manuals, On-Line Certifications | |
|
|
An Organizational Task Management System. Projects, Meetings, Audits & more | |
|
|
Corrective Action Software | |
 |
Plan and Track Training | |
 |
AQL Inspection Software |
 |
450+ Editable Slides with support links | |
 |
Learn and Train TRIZ | |
 |
Editable Template | |
 |
Templates, Guides, QA Manual, Audit Checklists | |
 |
EMS Manual, Procedures, Forms, Examples, Audits, Videos | |
 |
On-Line Accredited Certifications Six Sigma, Risk Management, SCRUM | |
|
|
Software, Videos, Manuals, On-Line Certifications |