Matrix Diagram

Description:
The matrix diagram shows the relationship between two, three or four groups of information. Depending on the type of matrix, it may illustrate supporting information about the relationship, such as the relationship strength, the roles played by various individuals or measurements. Here we discuss six differently shaped matrices, L, T, Y, X, C and roof-shaped

This Data Analysis Video teaches you the basic tools for understanding, summarizing, and making future predictions with your collected data. Includes MS Excel templates.
When To Use:
Table 1 summarizes when to use each type of matrix diagram. In the below examples, we shaded the matrix axes to emphasize the letter that gives each matrix its name. You chose the matrix that matches the number of groups and interested interactions.
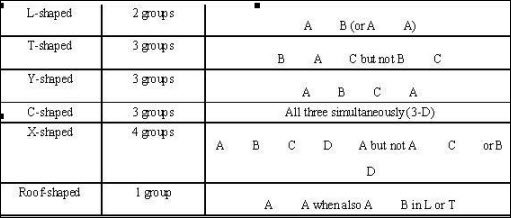
An L-shaped matrix relates two groups of items to each other (or one group to itself).
A T-shaped matrix diagram relates three groups of items: groups B and C are each related to A. Groups B and C are not related to each other.
A Y-shaped matrix relates three groups of items. Each group is related to the other two.
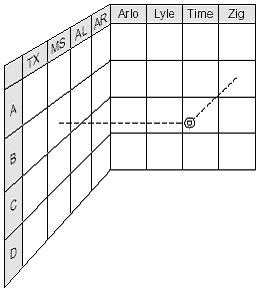
A C-shaped matrix simultaneously relates three groups of items at one 3-D point.
An X-shaped matrix relates four groups of items. Each group is related to two others.
A roof-shaped matrix relates one group of items to itself. It can be used by itself or as a roof to a L- or T-shaped matrix.
L-Shaped Matrix
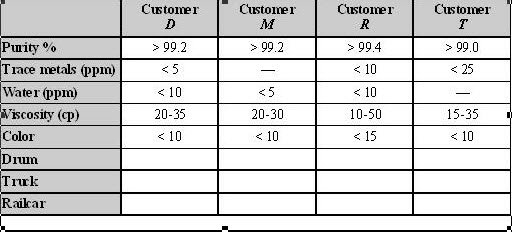
This L-shaped matrix summarizes customers' requirements. The team placed numbers in the boxes to show numerical specifications and used check marks to show choice of packaging.
PDCA Complete is an organizational task management system with built-in continuous improvement tools. Includes projects, meetings, audits and more.
Built by Quality Assurance Solutions.
The L-shaped matrix actually forms an upside-down L. This is the most basic and most common matrix format.
T-Shaped Matrix
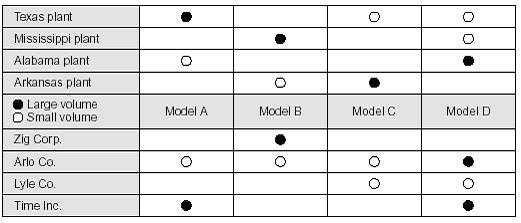
This T-shaped matrix relates product models (group A) to their manufacturing locations (group B) and to their customers (group C). Examining the matrix in different ways reveals different information.
For example, concentrating on model A, we see the Texas plant produces it in a large volume and the Alabama plant manufactures a small volume. Time Inc. is the major customer for Model A, while Arlo Co. buys a small amount.
If we choose to focus on the customer rows, we learn only one customer, Arlo, buys all four models. Zig buys just one. Time makes large purchases of A and D, while Lyle is a relatively minor customer.
Y-Shaped Matrix
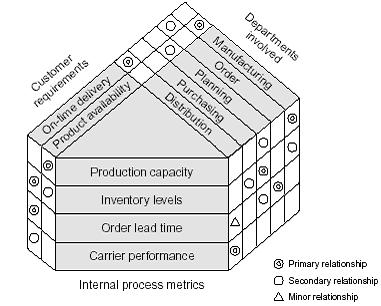
This Y-shaped matrix shows the relationships between customer requirements, internal process metrics and the departments involved. Modified symbols show the strength of the relationships:
- A primary relationship is the manufacturing department's responsibility for production capacity.
- A secondary relationship is the link between product availability and inventory levels.
- A minor relationships is the distribution departments responsibility for order lead time.
- There is no relationship between the purchasing department and on-time delivery.
TrainingKeeper Software. Keep, organize and plan all your employees' training and activities. Software includes multi-user support with reports, certs, and calendars.
The matrix tells an interesting story about on-time delivery. The company assigned the distribution department primary responsibility for the on-time requirement. Two metrics that most strongly relate to on-time delivery are inventory levels and order lead time. Of the two, distribution has only a weak relationship with order lead time and none with the inventory levels. Perhaps the responsibility for on-time delivery needs to be reconsidered. Based on the matrix, where would you put responsibility for on-time delivery?
C-Shaped Matrix
Think of C meaning cube.Because this matrix diagram is three-dimensional, it is difficult to draw and infrequently used.
If it is important to compare three groups simultaneously, consider using a three-dimensional model or computer software that can provide a clear visual image.
This figure shows one point on a C-shaped matrix relating products, customers and manufacturing locations. Zig Company's model B is made at the Mississippi plant.
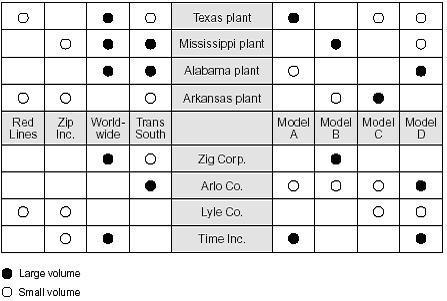
X-Shaped Matrix
This figure extends the T-shaped matrix example into an X-shaped matrix by including the relationships of freight lines with the manufacturing sites they serve and the customers who use them.
Each axis of the matrix is related to the two adjacent ones, but not to the one across. Thus, the product models are related to the plant sites and to the customers, but not to the freight lines.

SWOT Manager lets you manage and quickly create your brainstorm SWOTs. Compare the past and track the future.
A lot of information can be contained in an X-shaped matrix diagram. In this one, we observe that Red Lines and Zip Inc., which seem to be minor carriers based on volume, are the only carriers that serve Lyle Co. Lyle doesn't buy much, but it and Arlo are the only customers for model C. Model D is made at three locations, while the other models are made at two. What other observations can you make?
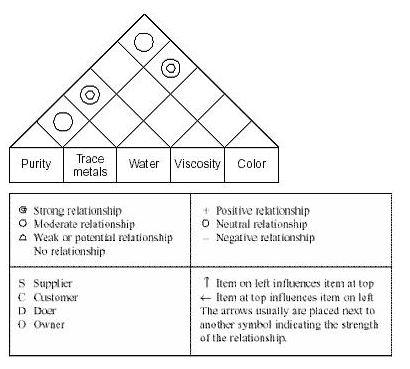
Roof-Shaped Matrix Diagram
The roof-shaped matrix is used with an L- or T-shaped matrix to show one group of items relating to itself. It is most commonly used with the house of quality, where it forms the roof of the house.
In the figure below, the customer requirements are related to one another. For example, a strong relationship links color and trace metals, while viscosity is unrelated to any of the other requirements.
More Info
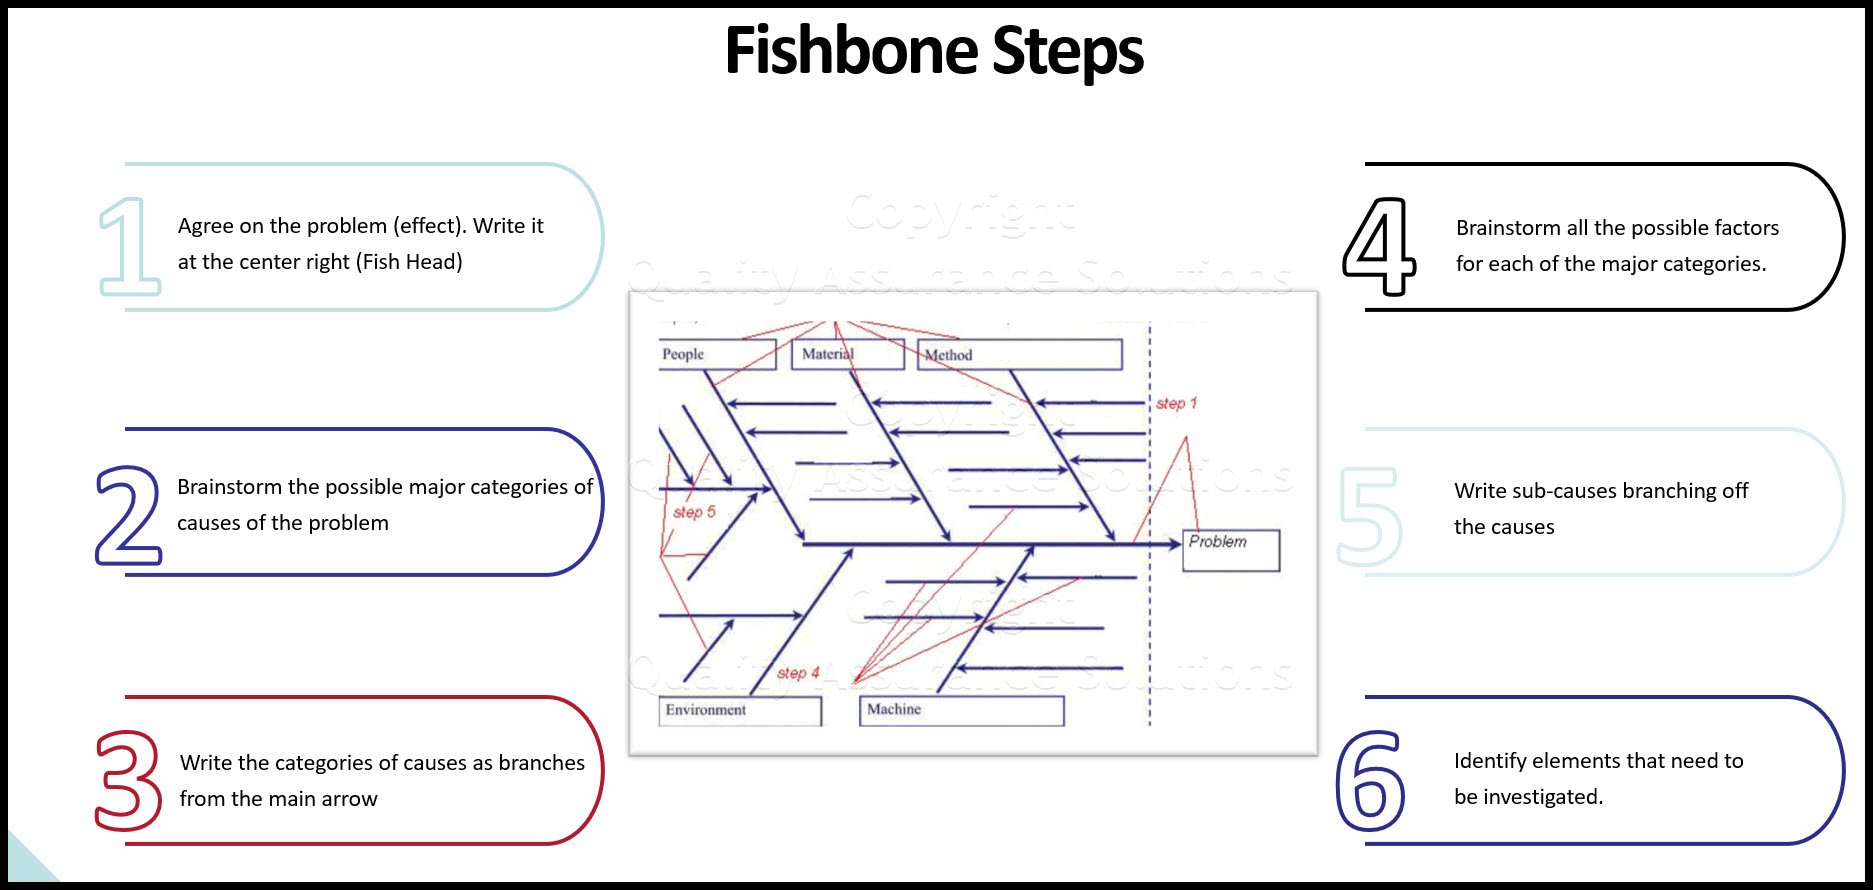
Fish Bone
Learn the steps to create a Fish Bone diagram.
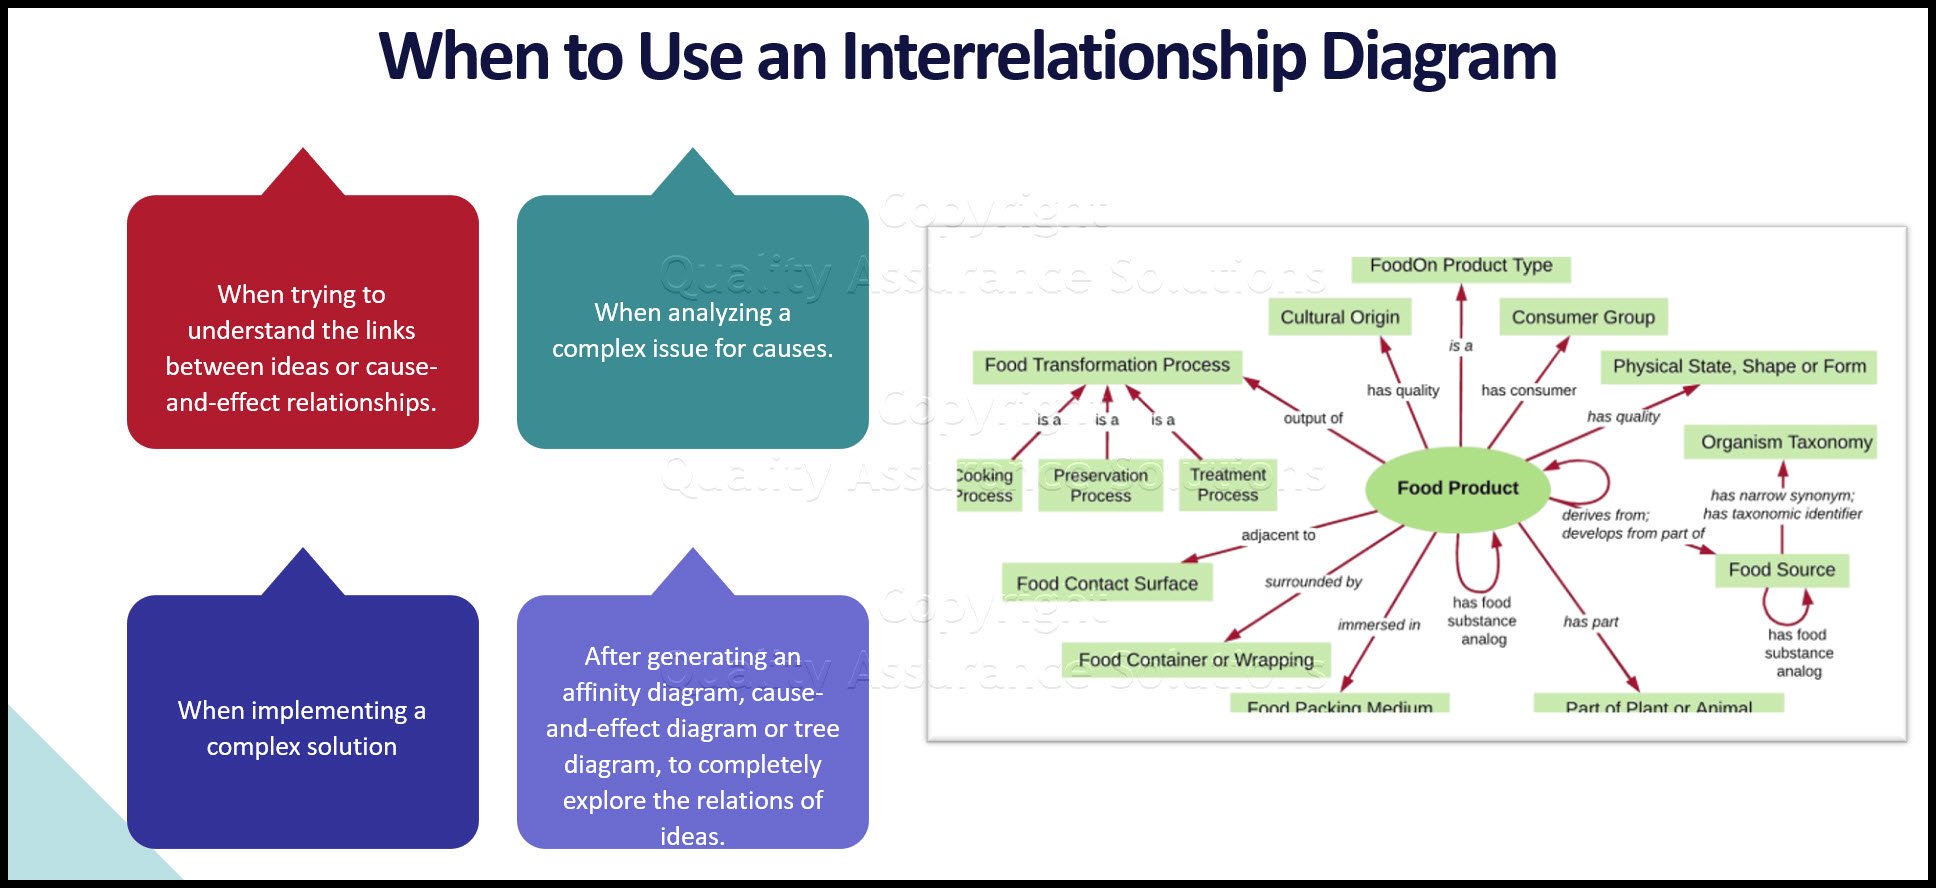
Interrelationship Diagram
Learn the steps to create an interrelationship diagram. Article also provides insight on when to use it too.
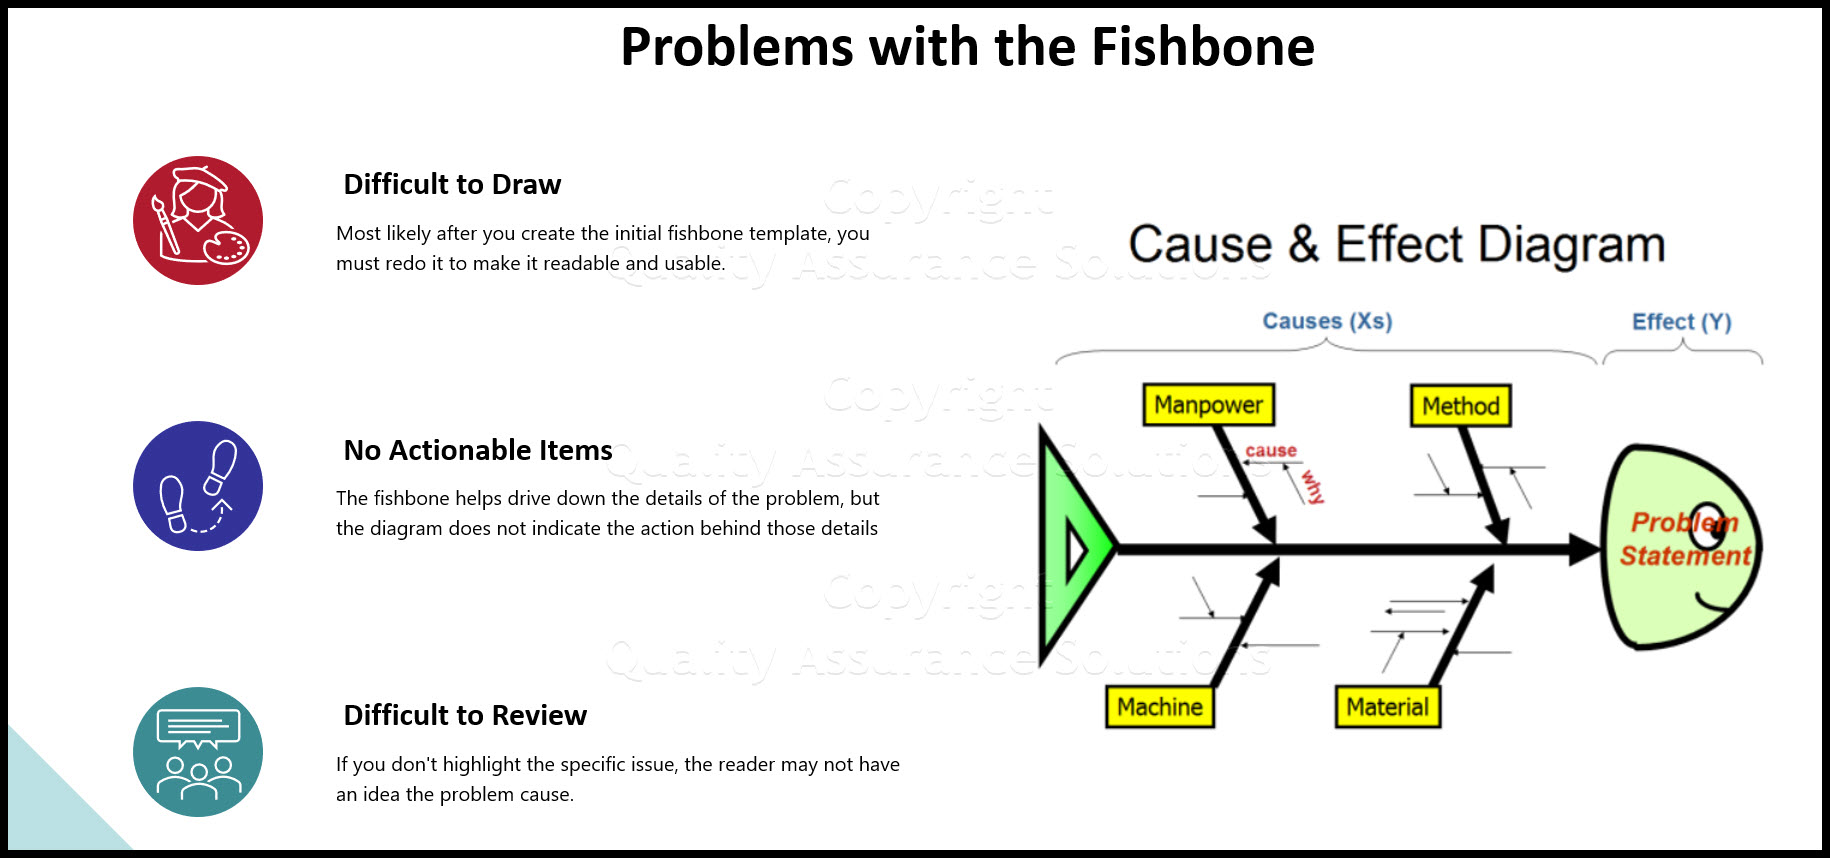
Fishbone Template Problems and Downloads
This page discusses how to improve the fishbone template, documents problems with the fishbone diagram template and fishbone charts.
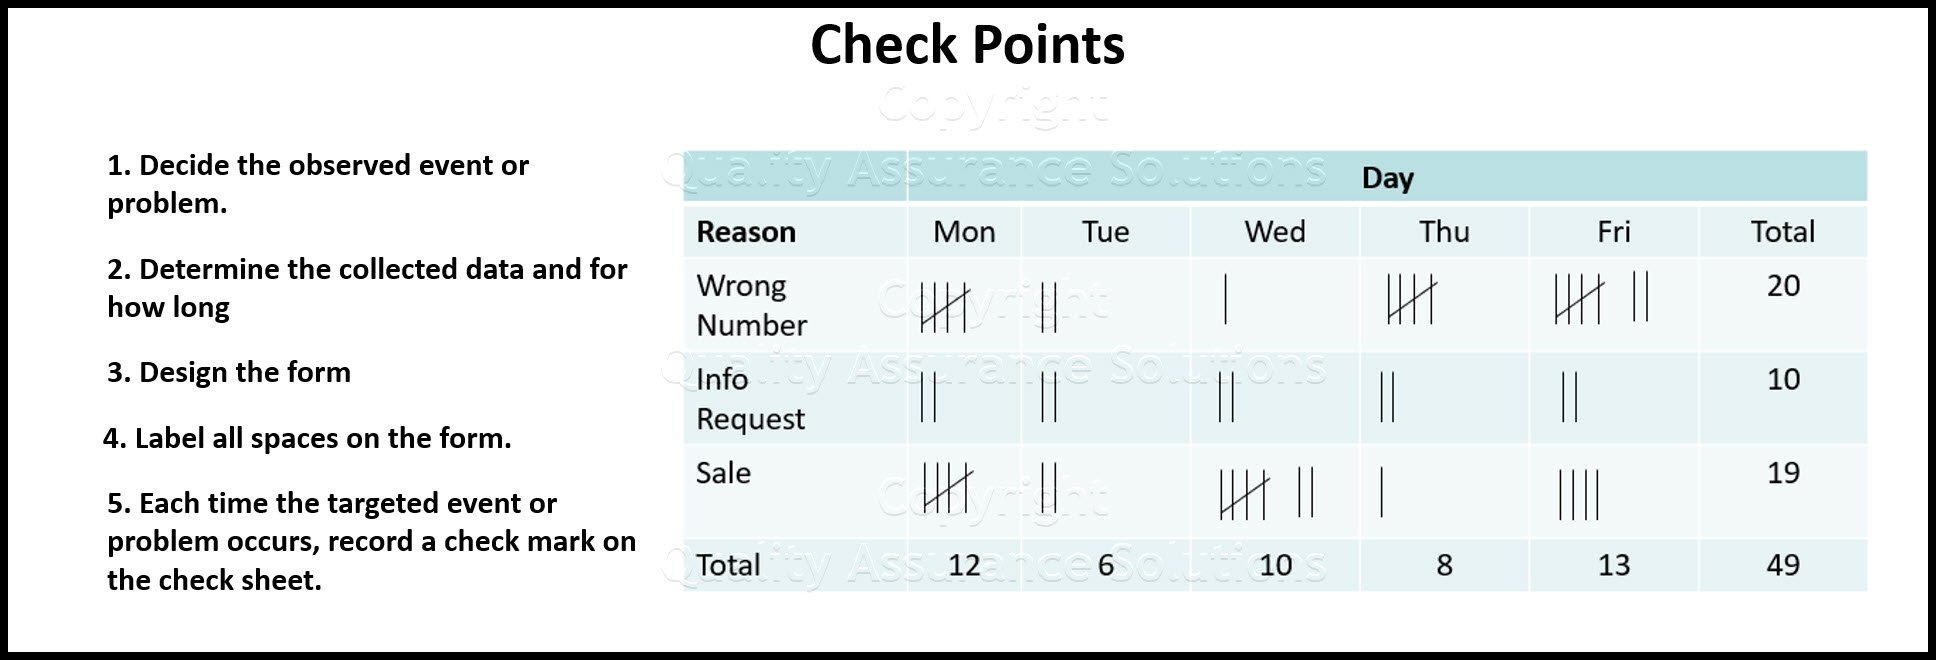
Check Points
Review this procedure creating check points, a continuous improvement tool. We include an example of a tally sheet too.
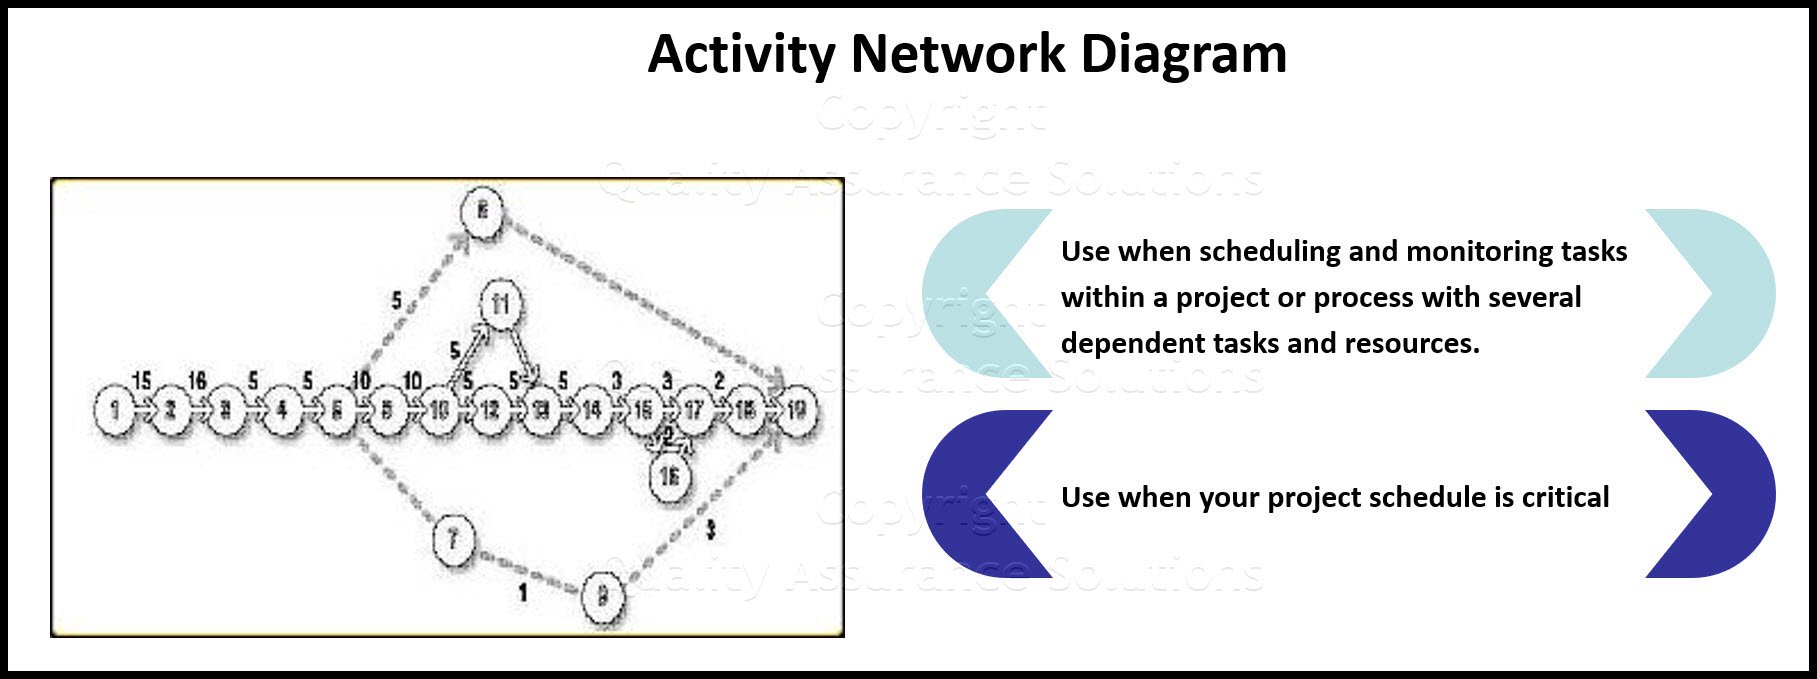
Details on Activity Network Diagram
The what, when, how and why of Activity Network Diagram
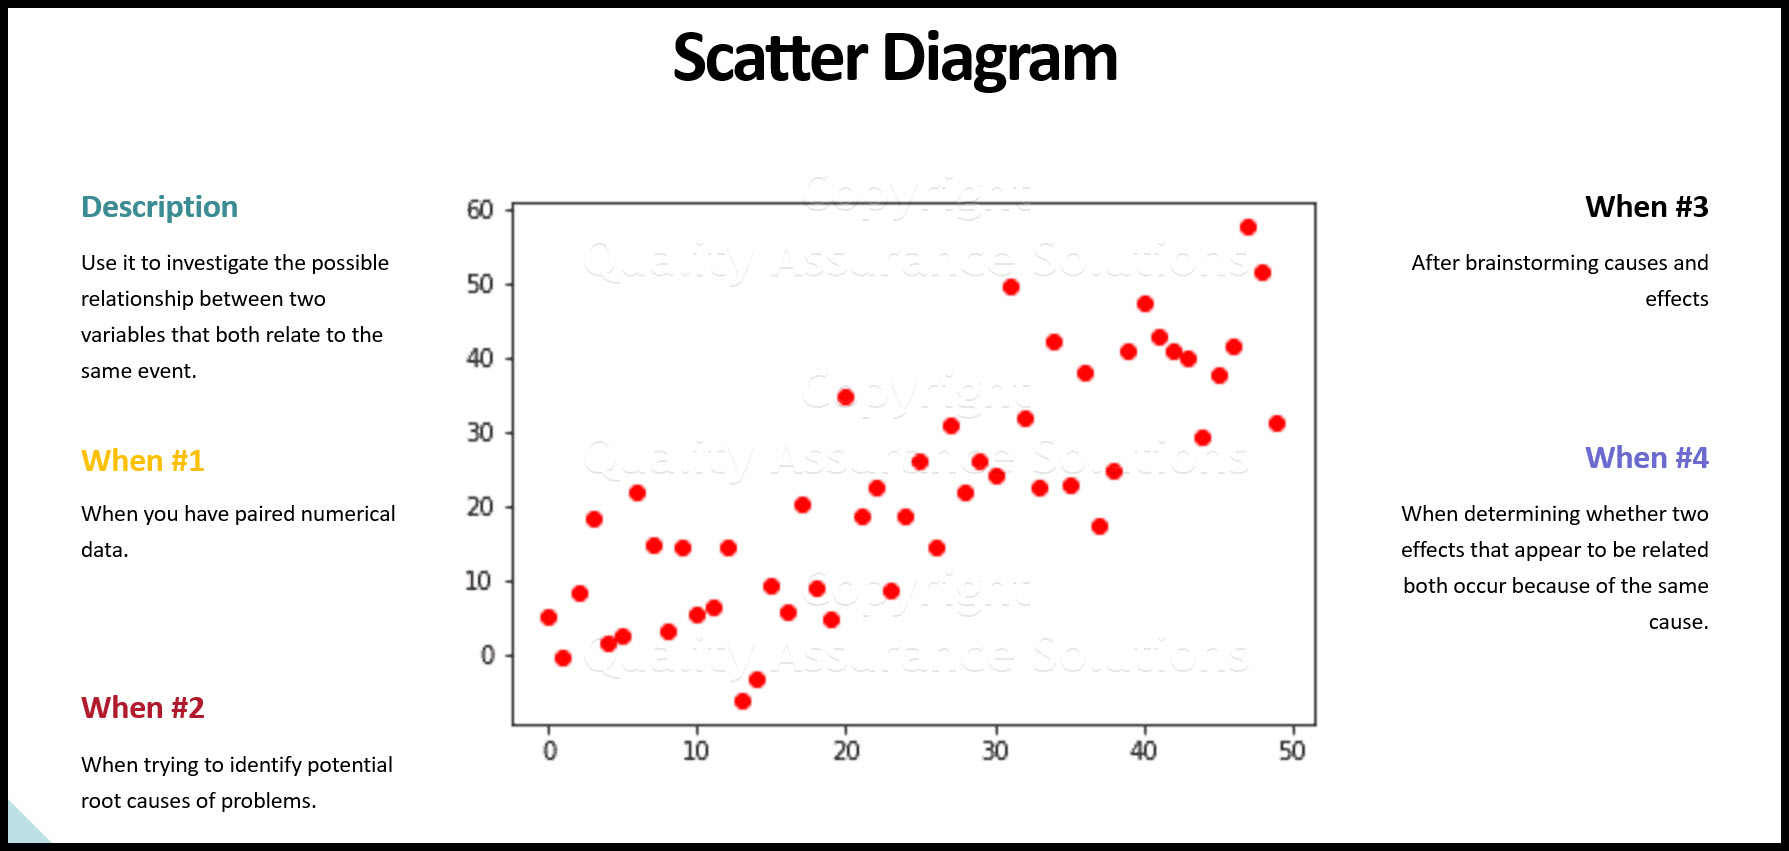
Scatter Diagram
Use a Scatter Diagram to investigate possible relationships. This article provides step by step instructions to creating one
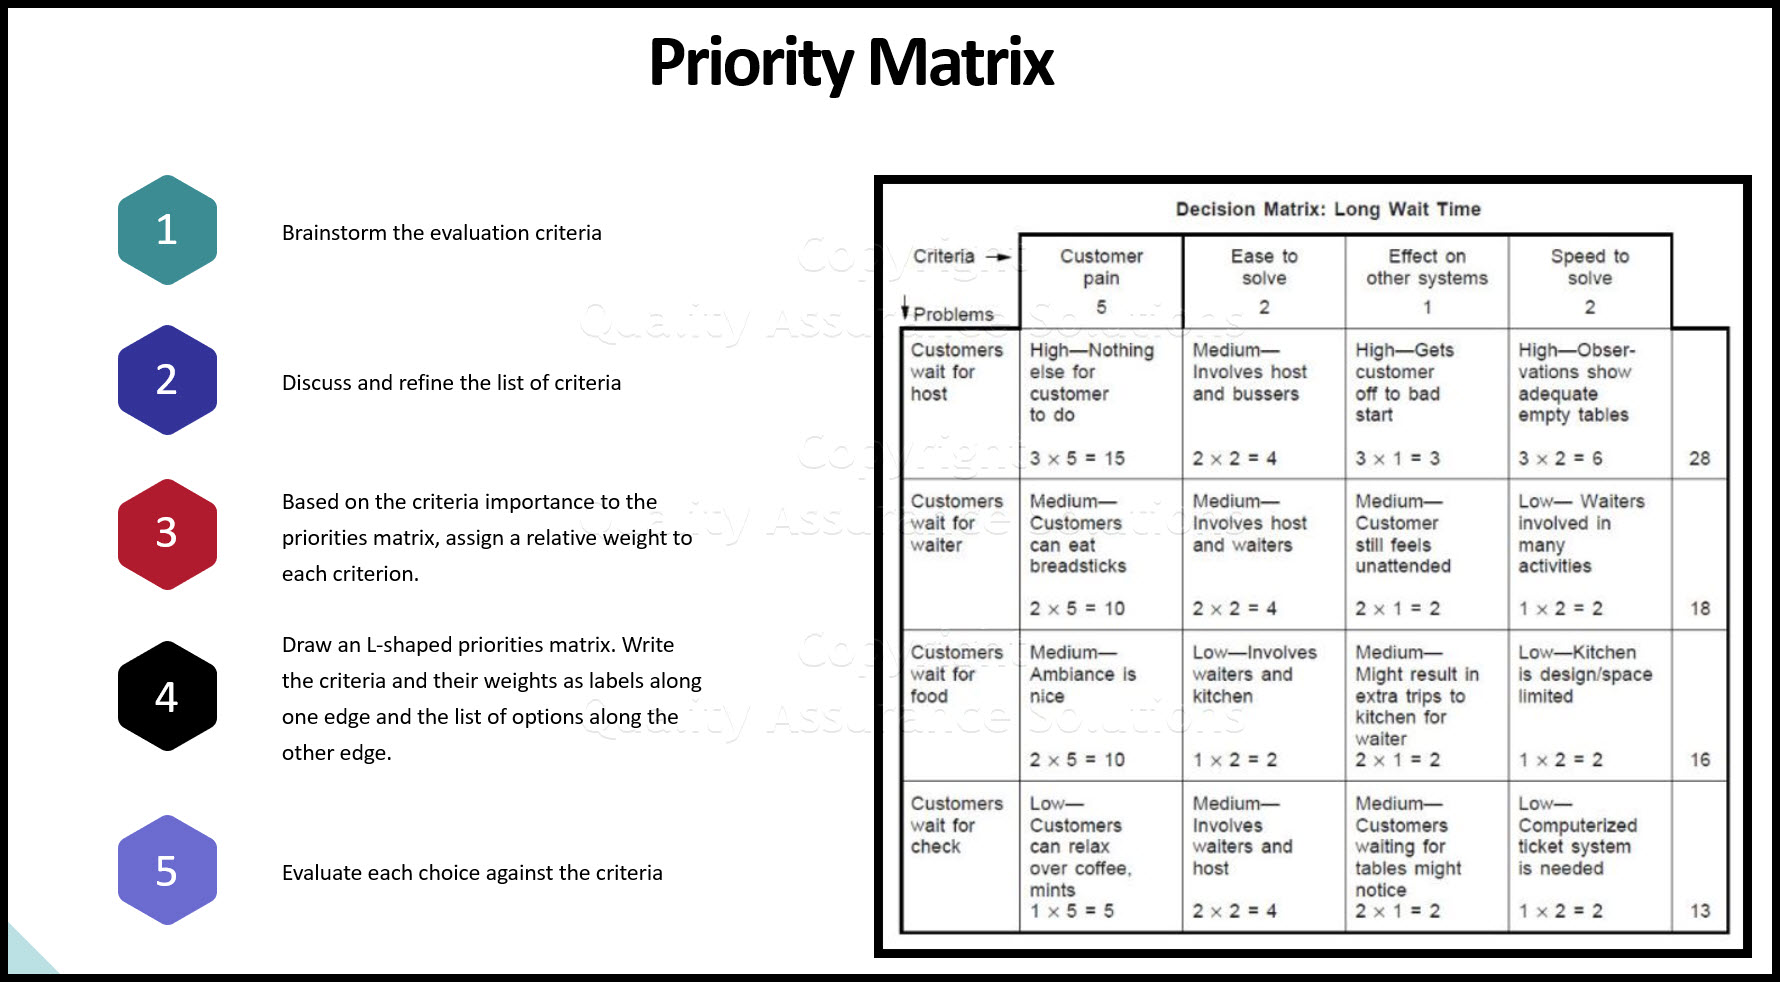
Priorities Matrix
A priorities matrix evaluates and prioritizes a list of options. Learn to formally construct one and analyze the results.
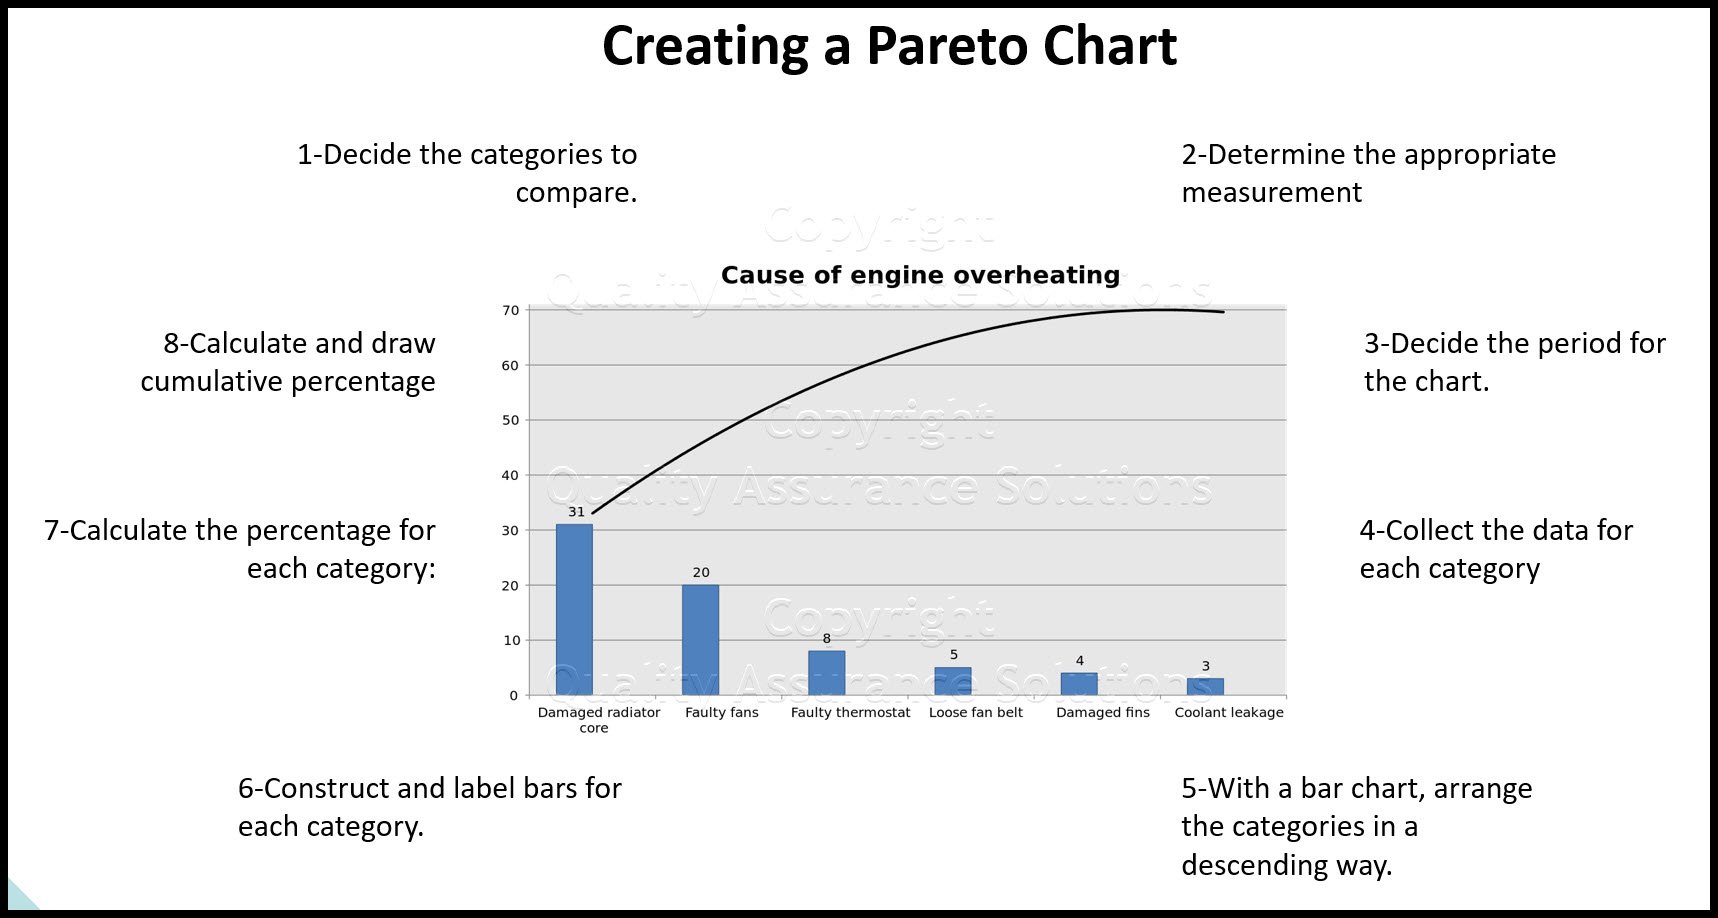
Pareto Chart
The Pareto chart is one of the total quality management tools and usually used during the define stage in six sigma
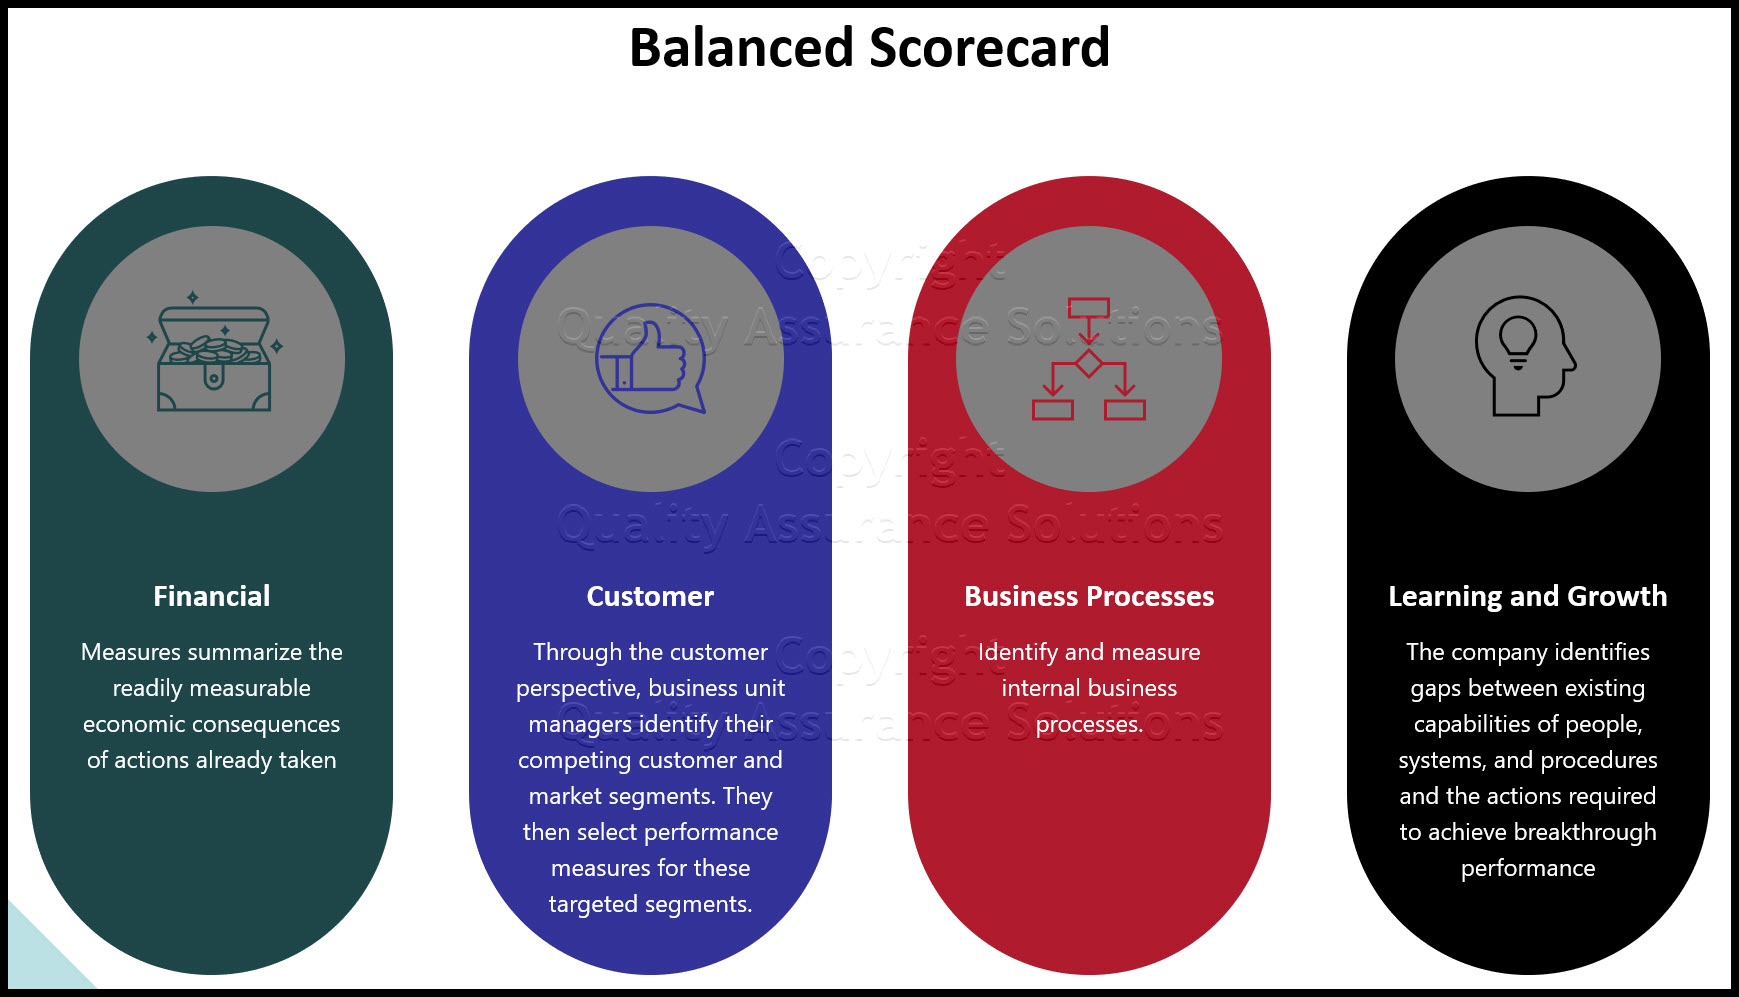
Balanced Scorecard
The Balanced Scorecard provides a clear prescription as to what companies should measure in order to 'balance' the financial perspective
Basic Tools for Process Improvement
Do you need a list of basic tools for process improvement? We provides a list of basic, advanced and favorite continuous improvement tools.
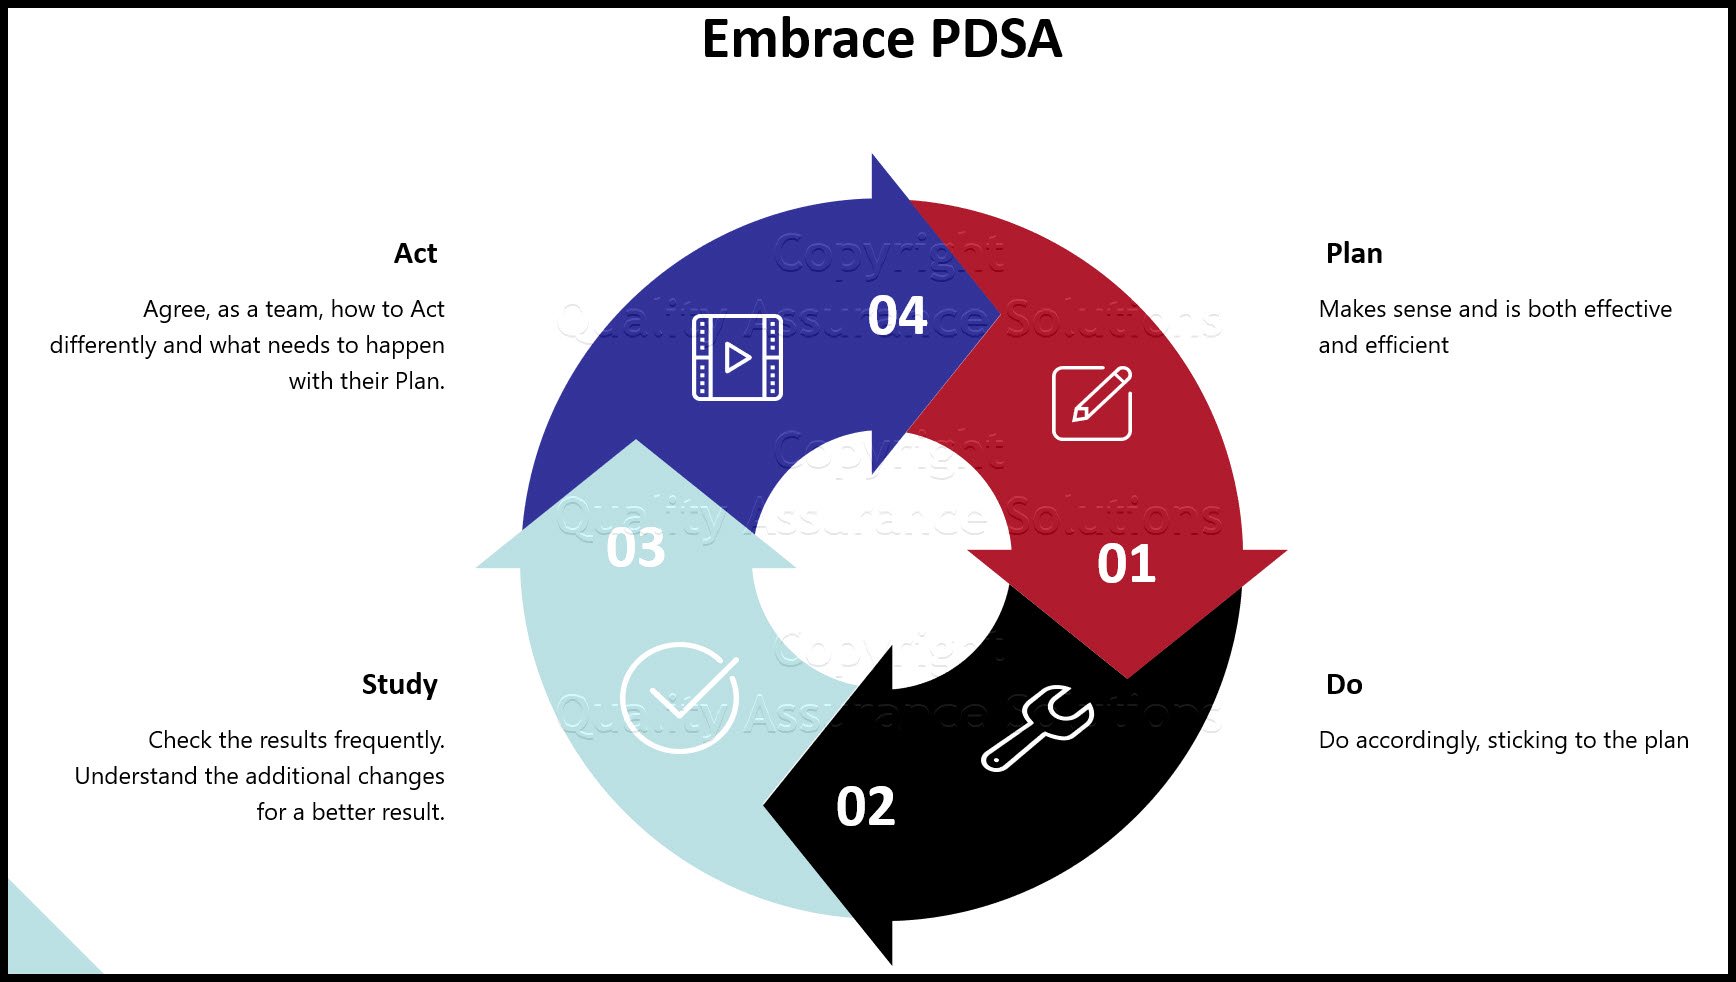
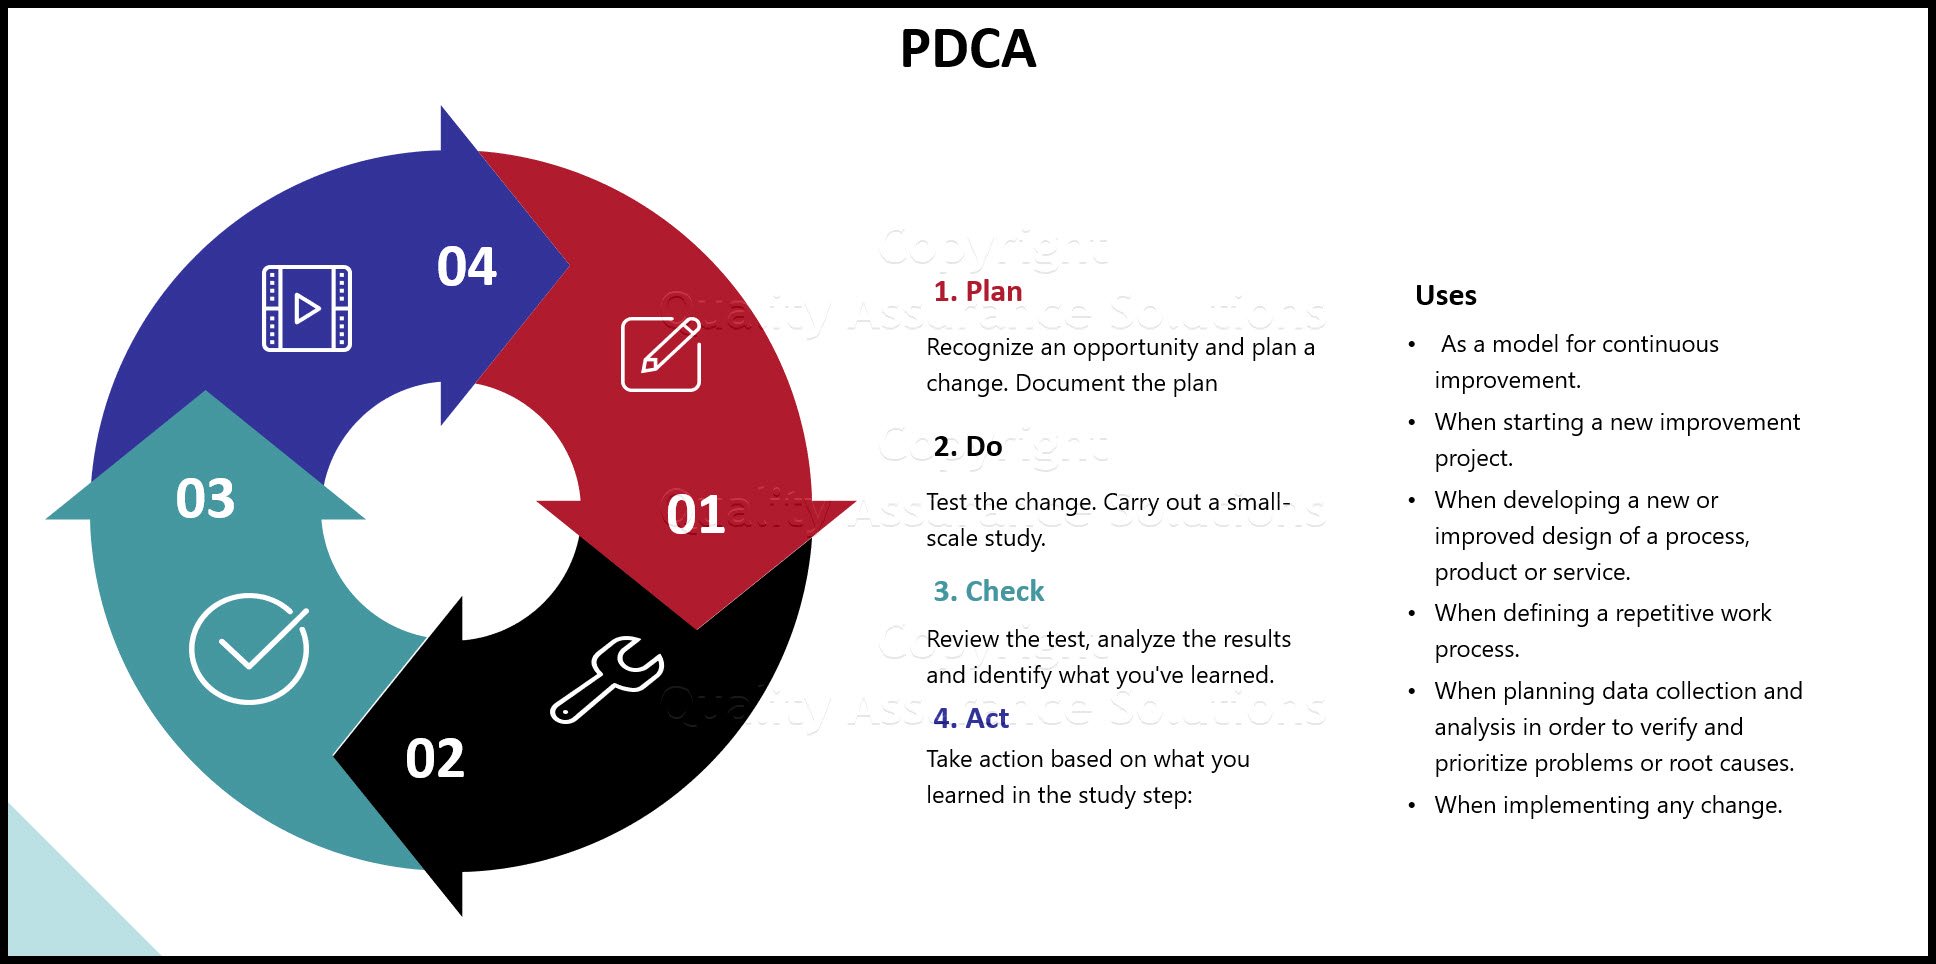
PDCA cycle
Learn the PDCA cycle, when to use it, how to construct it. We include an example of it too.
Customer Lifetime Value The Key
Customer lifetime value the key to understanding how much to invest into customer retention. Download a free spreadsheet for calculating LTV.

|
Quality Assurance Solutions Robert Broughton (805) 419-3344 USA |
 |


 |
Software, Videos, Manuals, On-Line Certifications | |
|
|
An Organizational Task Management System. Projects, Meetings, Audits & more | |
 |
Corrective Action Software | |
 |
Plan and Track Training | |
 |
AQL Inspection Software |
 |
450+ Editable Slides with support links | |
 |
Learn and Train TRIZ | |
 |
Editable Template | |
 |
Templates, Guides, QA Manual, Audit Checklists | |
 |
EMS Manual, Procedures, Forms, Examples, Audits, Videos | |
 |
On-Line Accredited Certifications Six Sigma, Risk Management, SCRUM | |
|
|
Software, Videos, Manuals, On-Line Certifications |